CASE-095 · Engineering case

Cooling Downtime-Cost and Repair-Risk Analysis

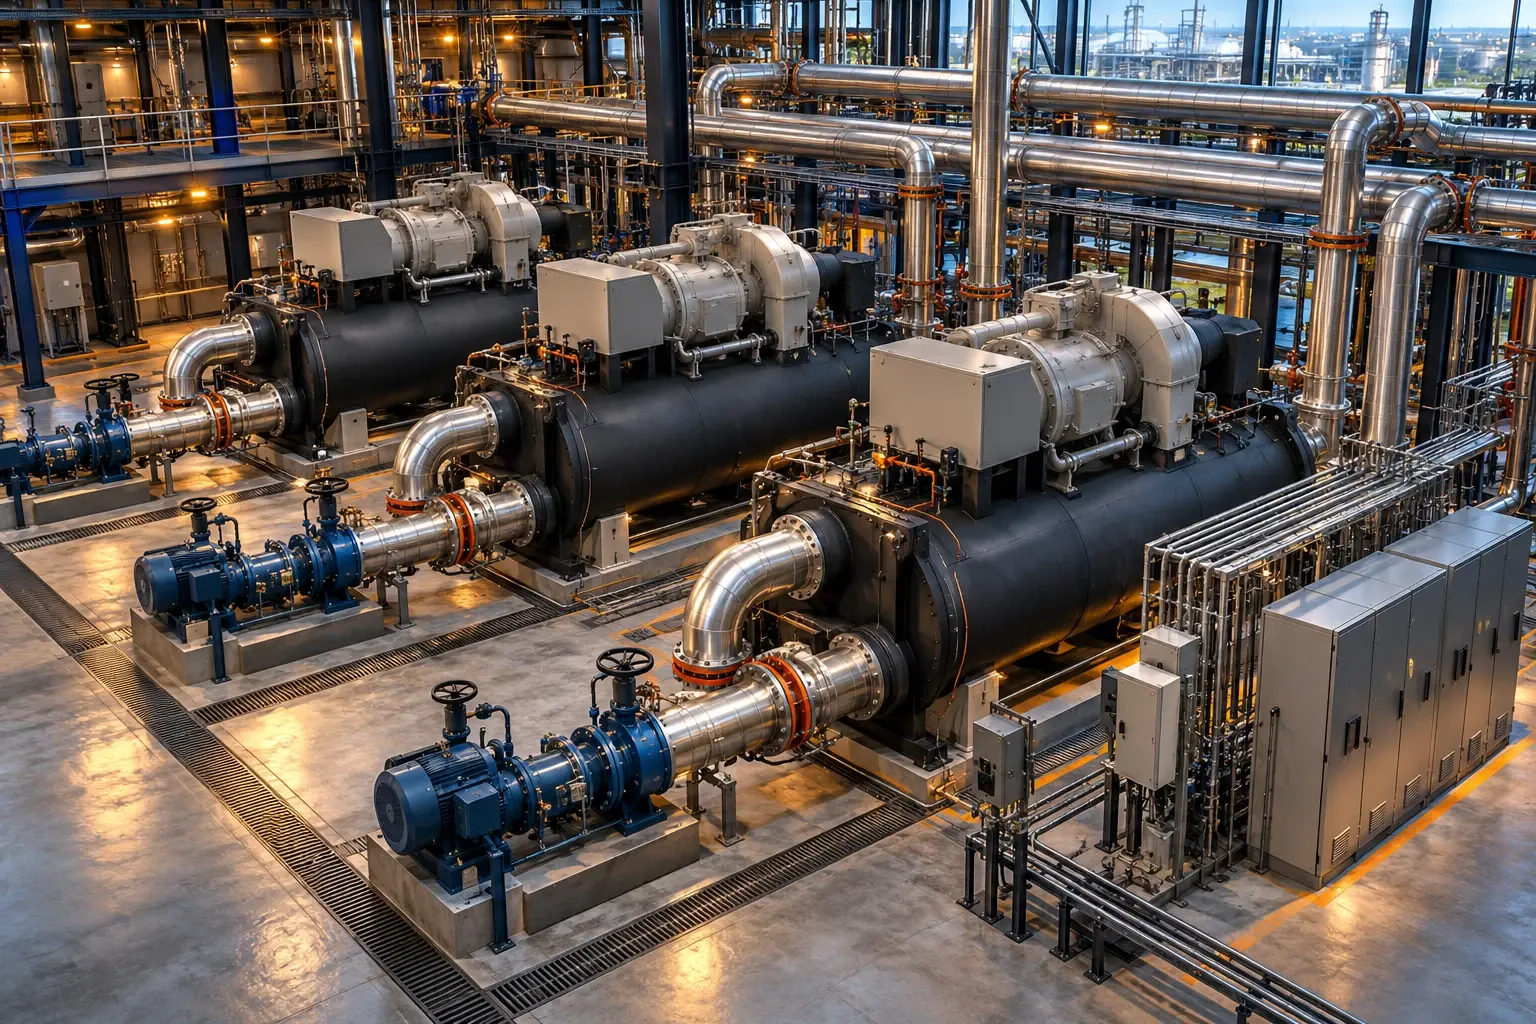
Modernized production cooling with three 160-ton chillers and coordinated piping, controls, electrical and BAS interfaces.

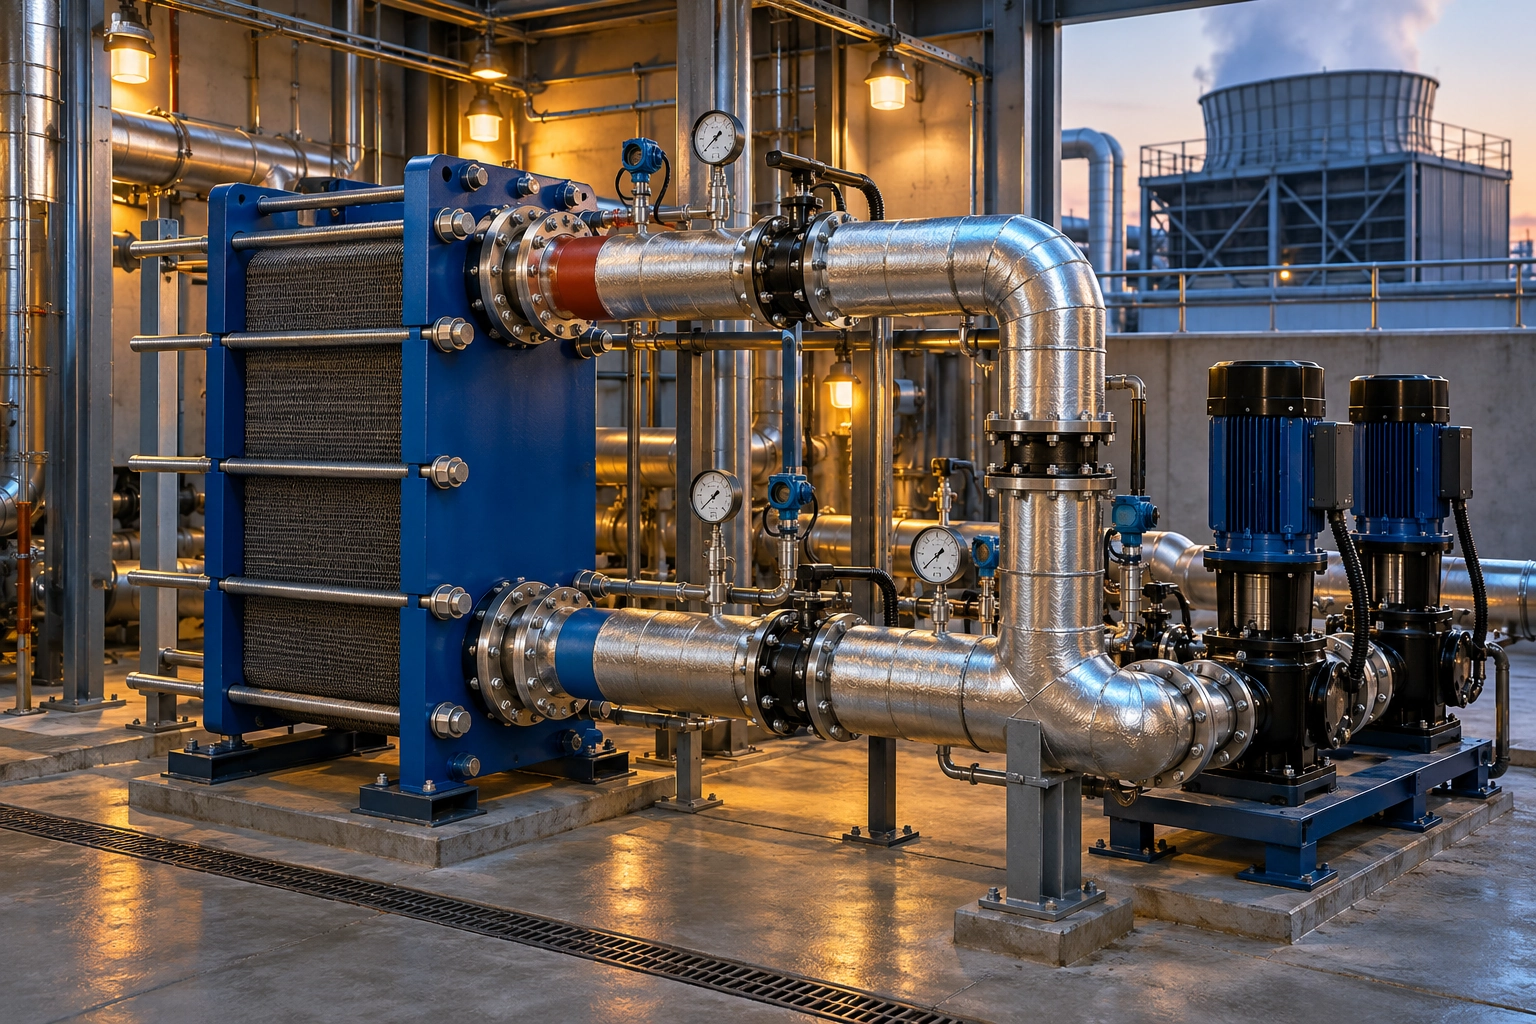
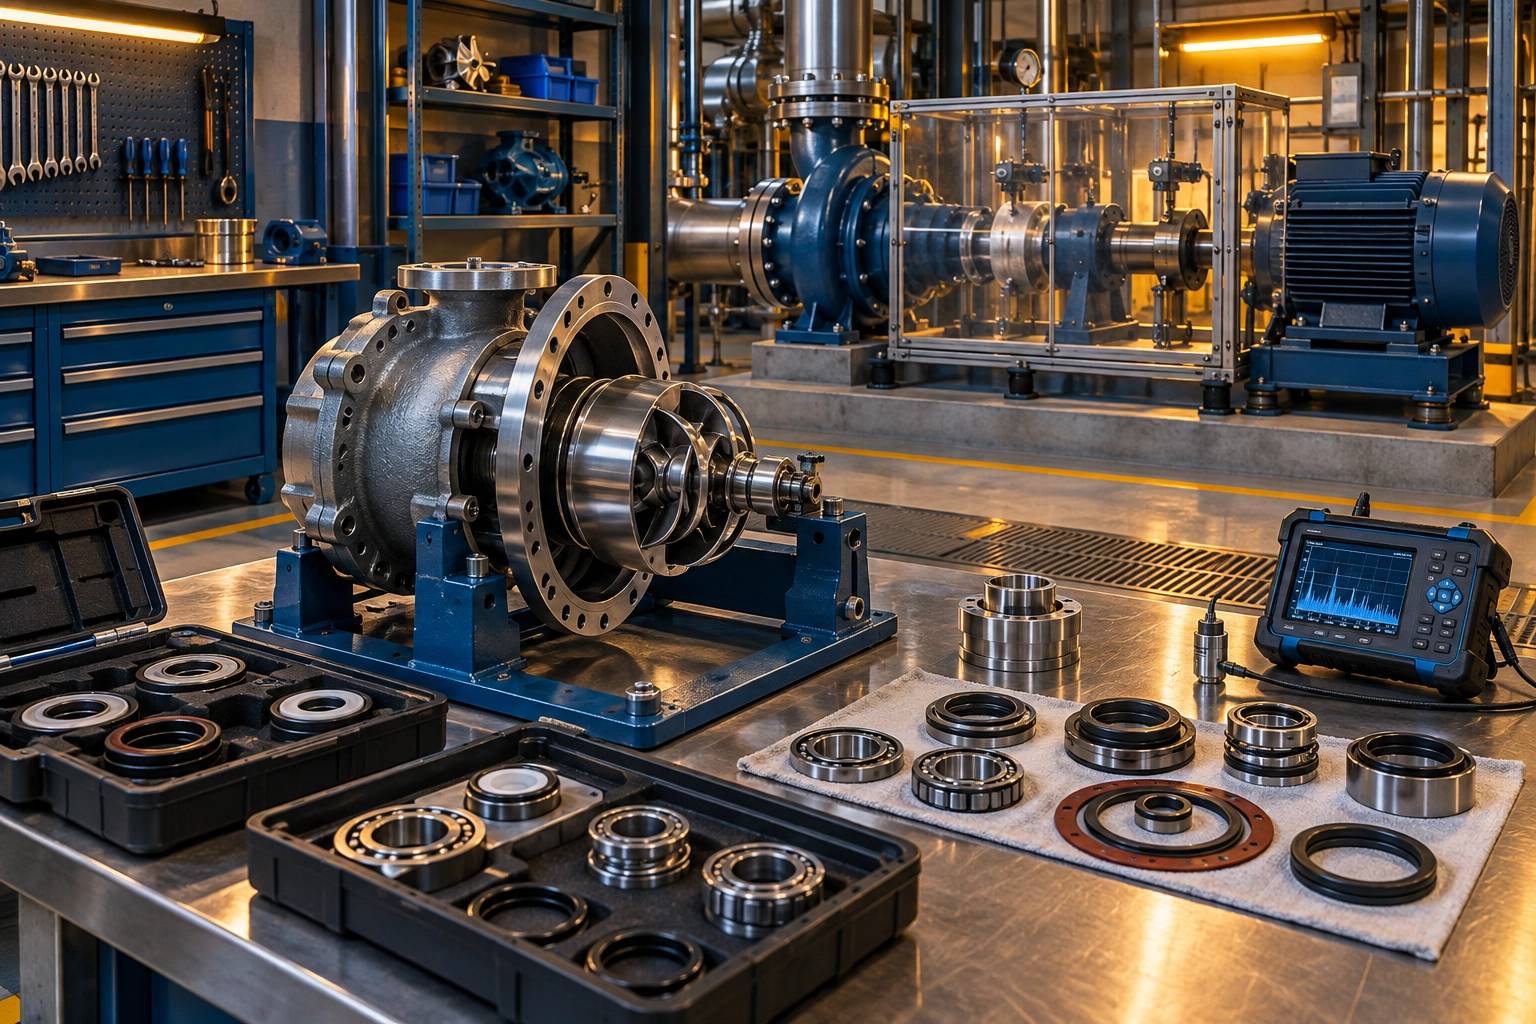
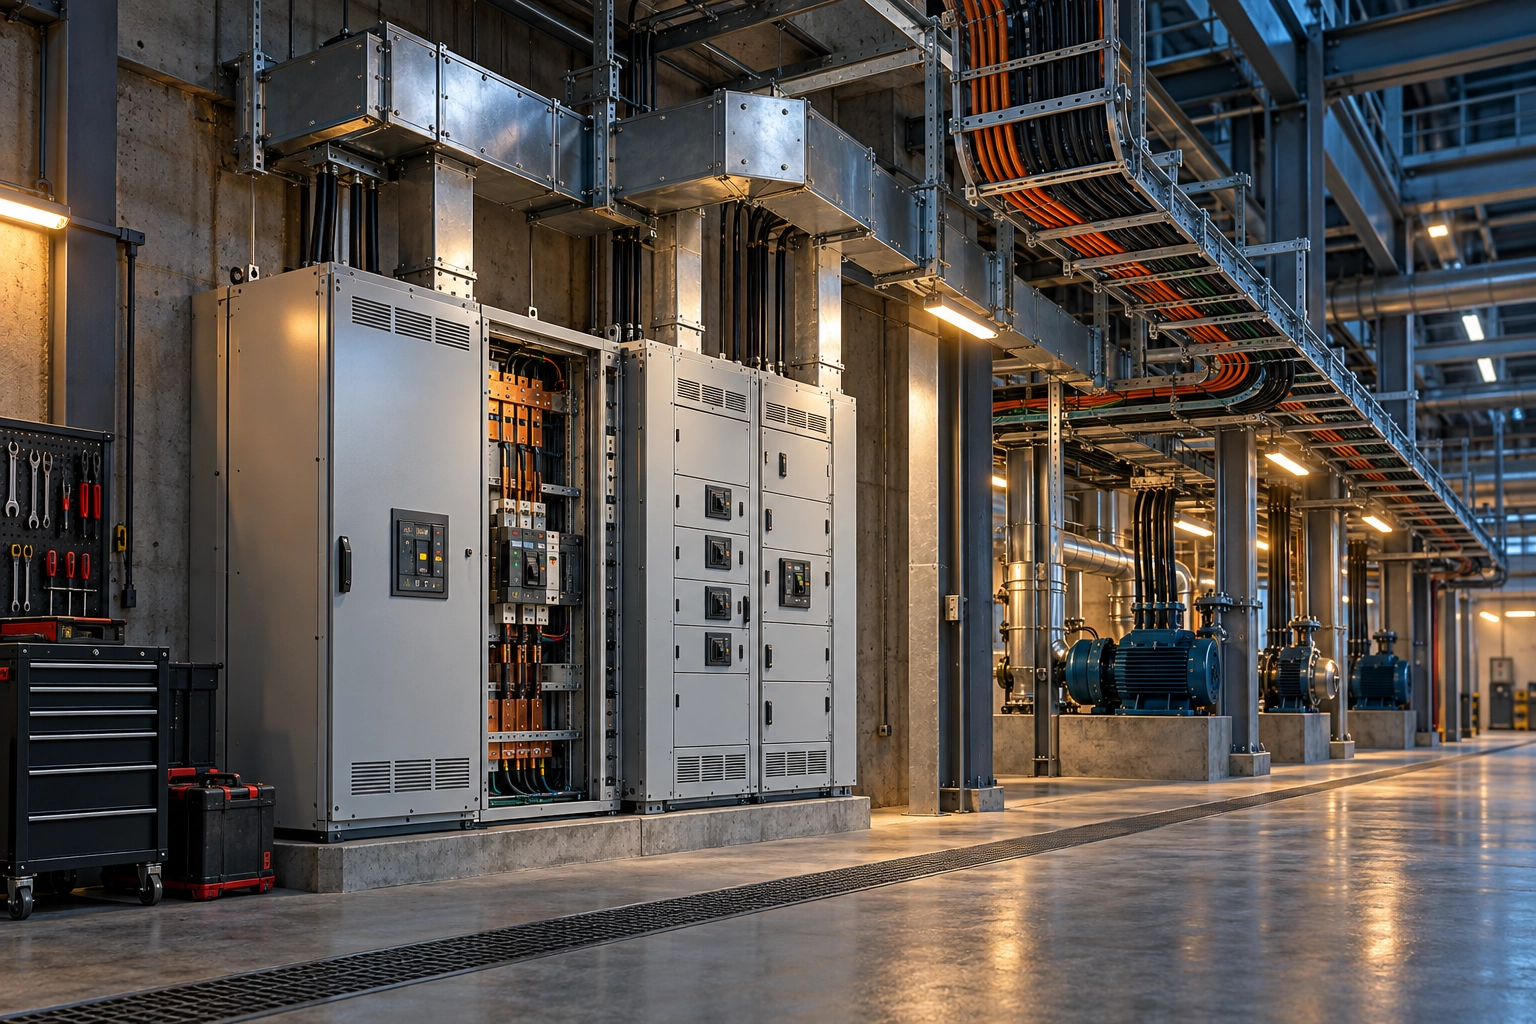
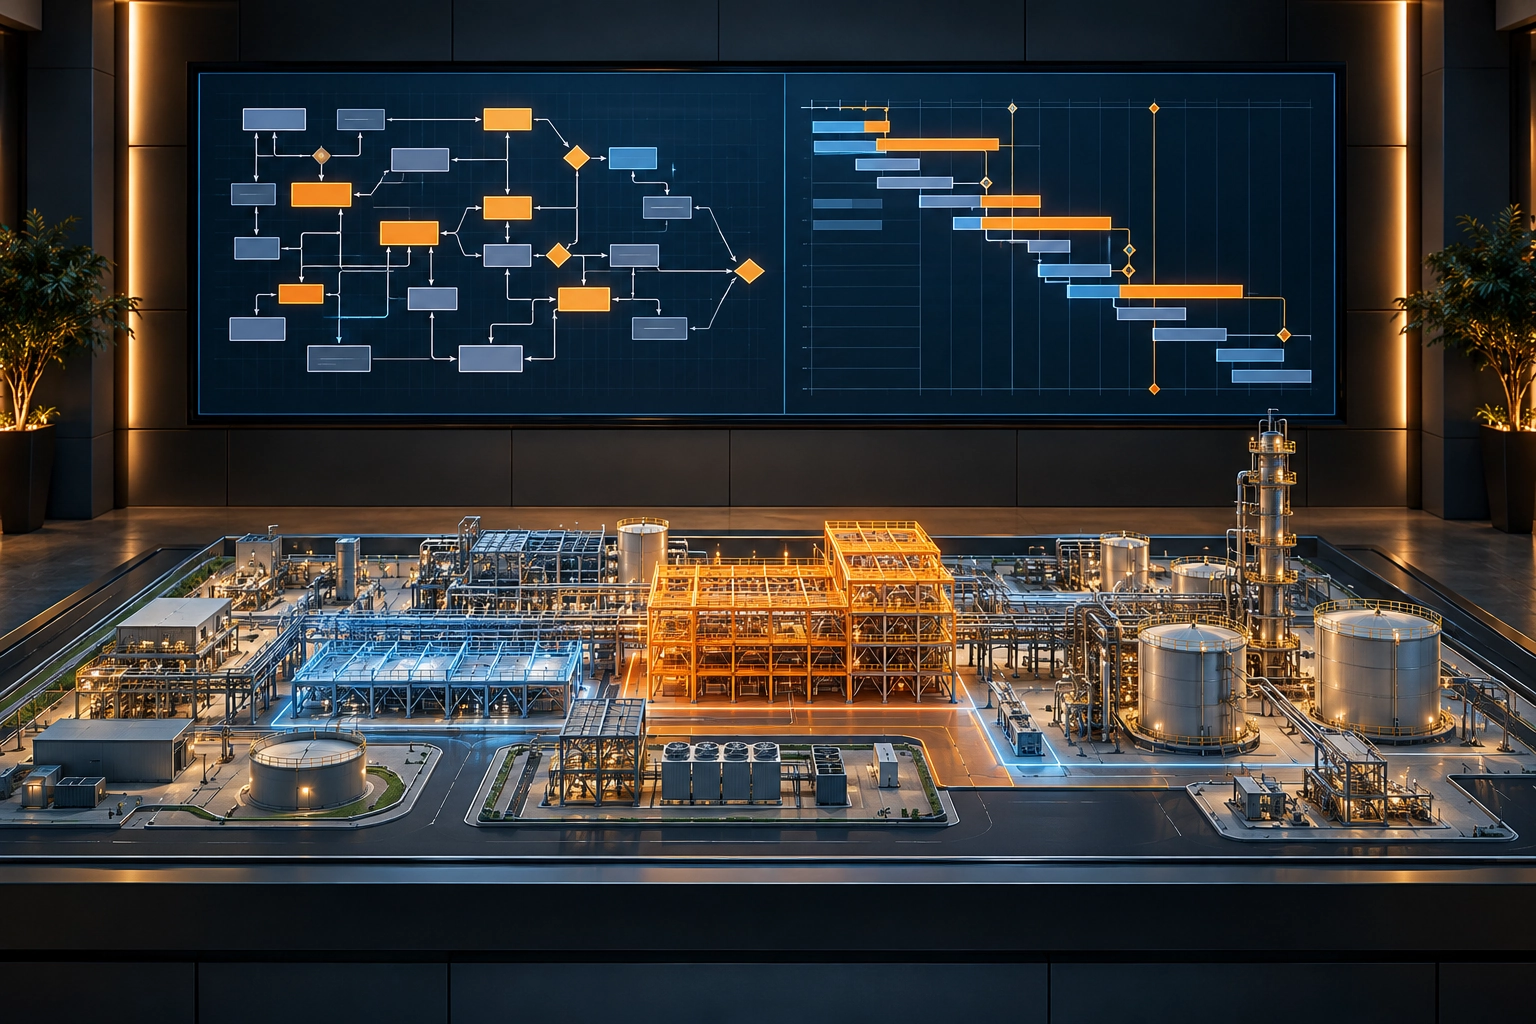
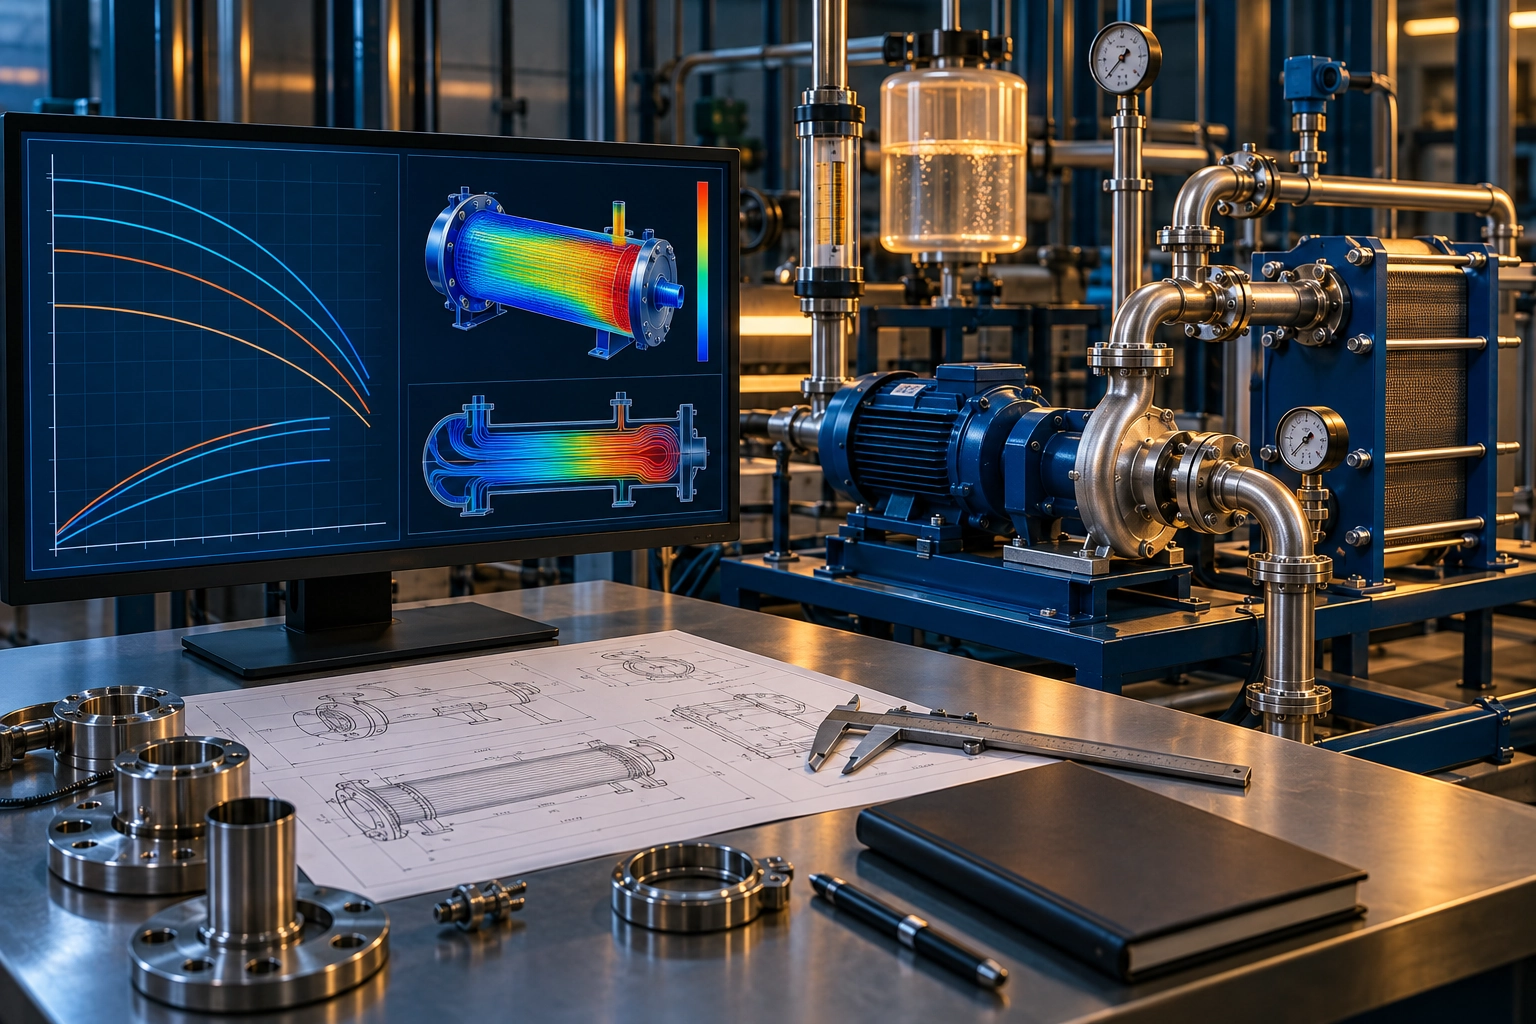
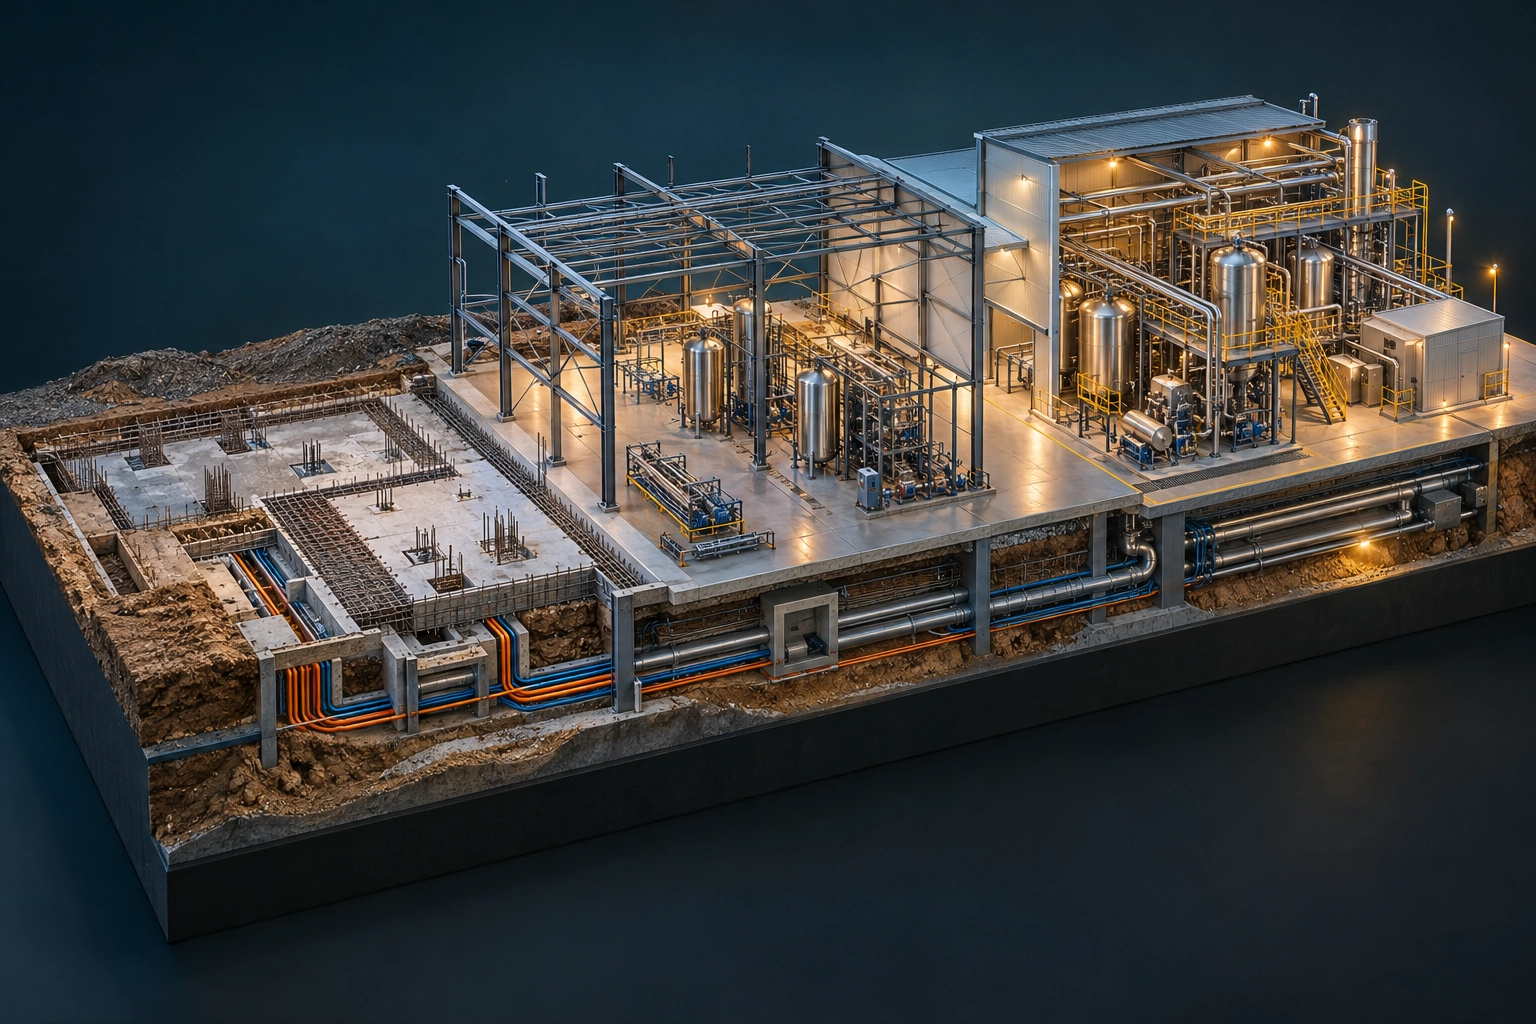
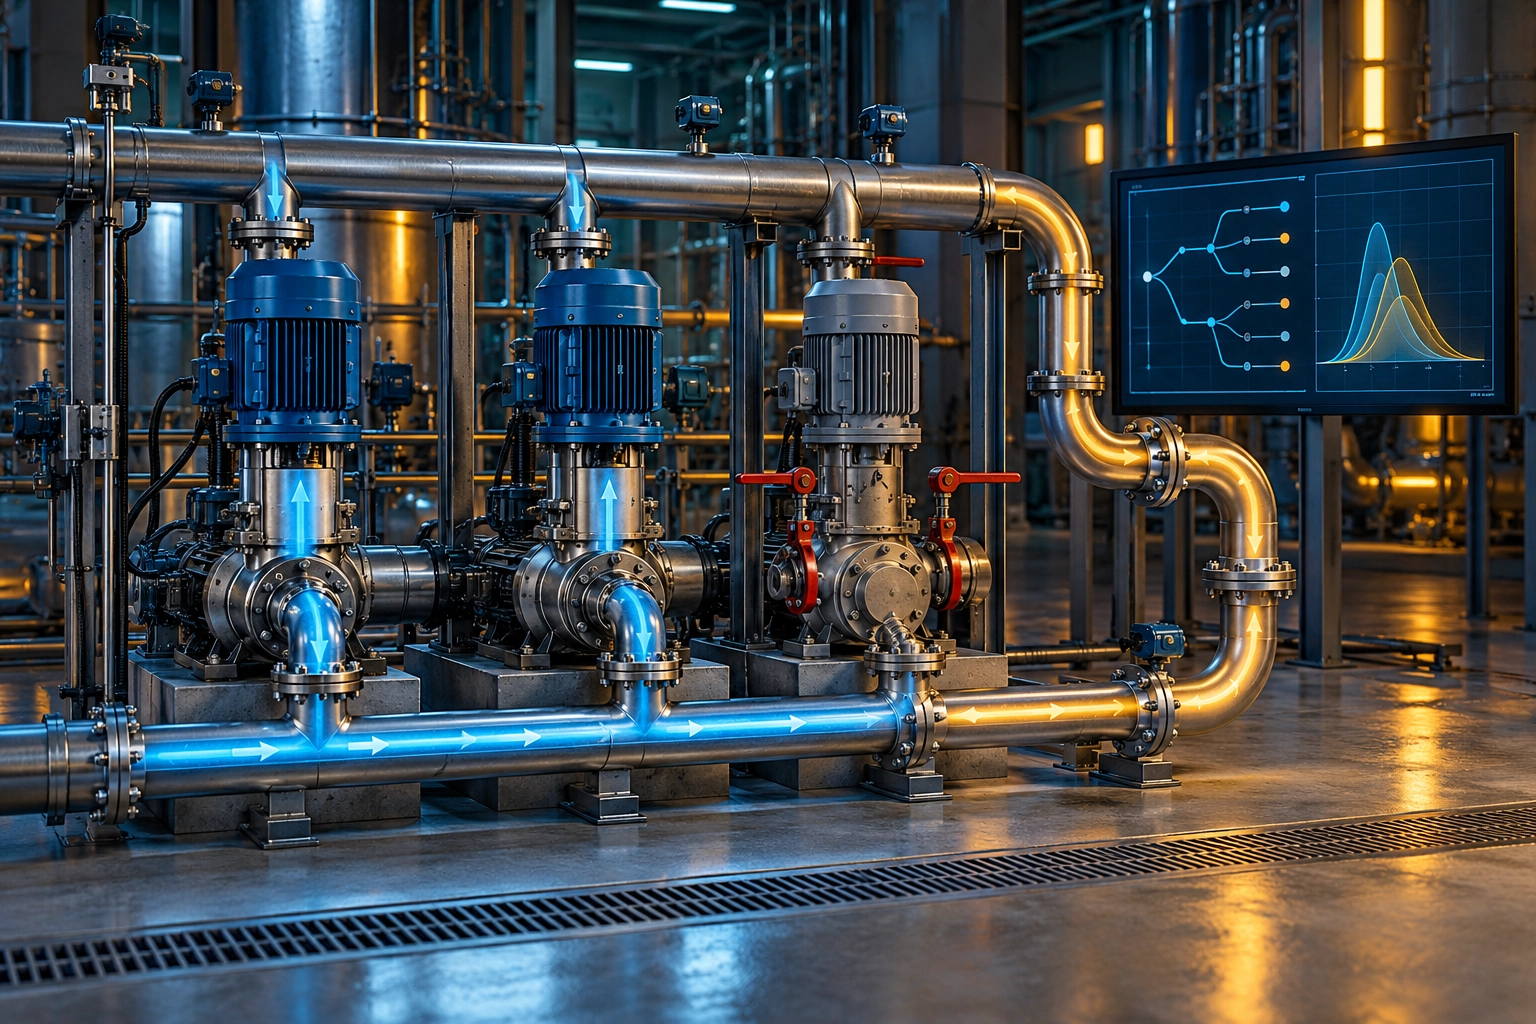
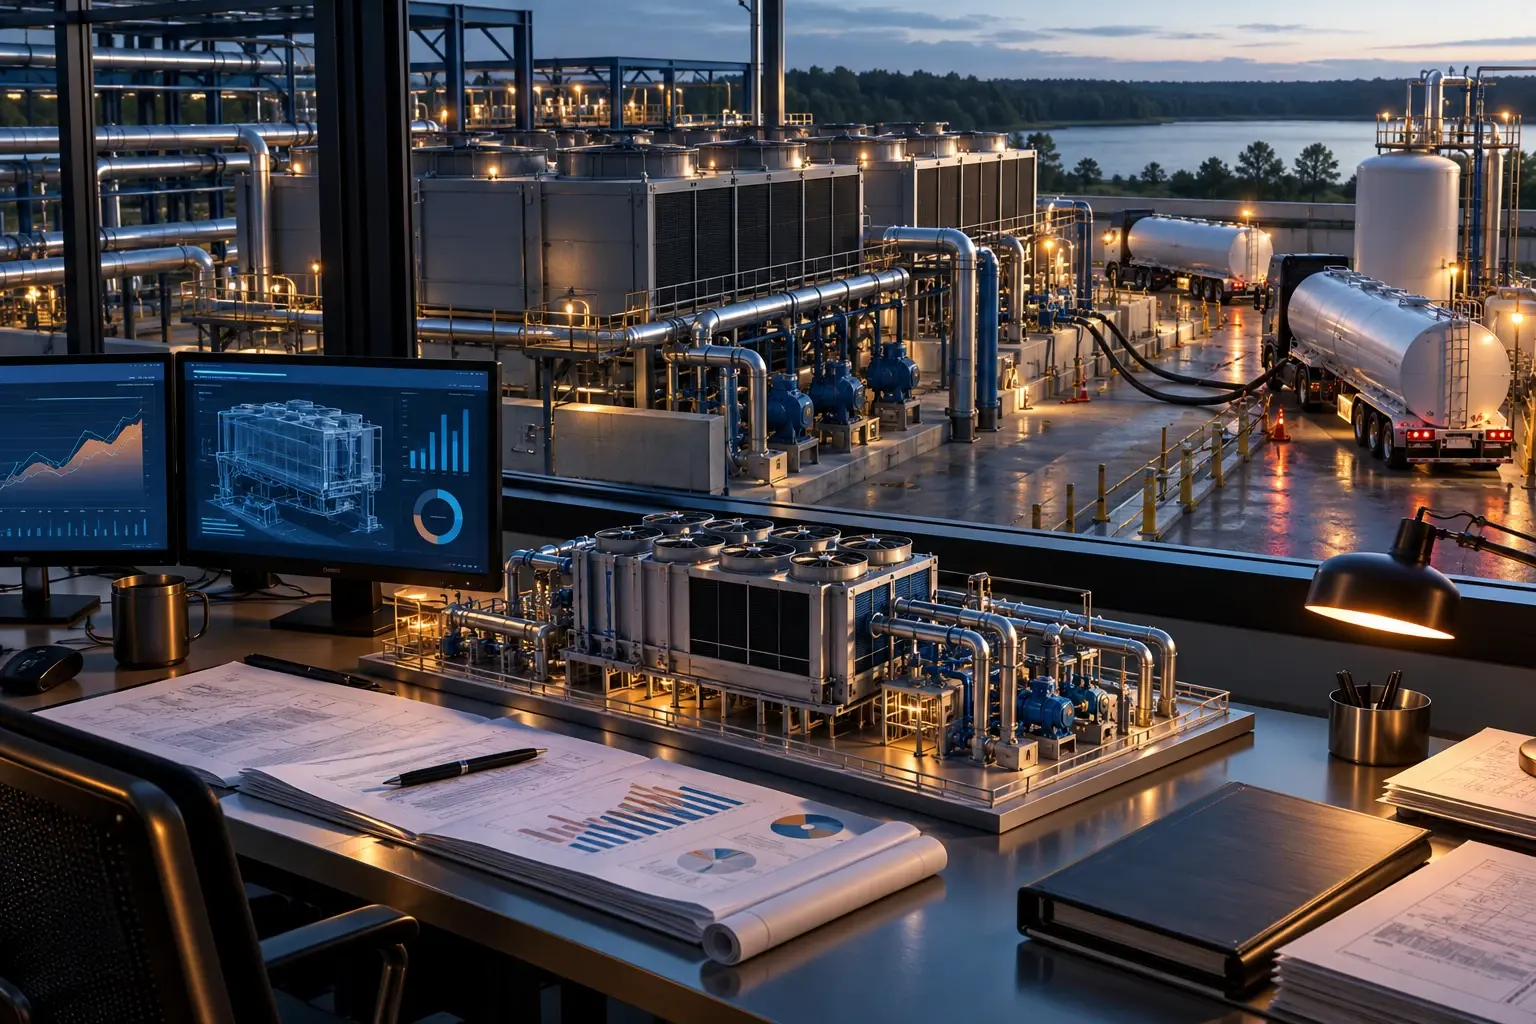
Conceptual engineering visualization: Cooling downtime-cost and repair-risk analysis
Conceptual engineering visualization · AI generated

Why the Work Mattered

Purpose and Operating Need

Reduced compressor-failure exposure and improved cooling reliability for critical acetator and fermenter operations.

Engineering Approach

Engineering Approach

Financial and risk modeling showed $1.80 OPEX exposure for every $1 in chiller repair cost, driven by freight, tanker hauling, and overtime from forced downtime; the model included temporary tanker operations between 2018 and 2020.

Outcome & Engineering Context

Outcome and Context

Added approximately 200 tons of net production-cooling capacity. The source records approximately 15% energy reduction at individual chiller feeder monitoring points. Cooling-project evidence records about $118k/year of OPEX reduction across the named production and standby cooling projects; it is not counted again as a separate portfolio-wide total.

Workstream Results & Impact

Workstream Portfolio Rollup

14,998,000 USD

Cooling and Utility Reliability Modernization

Recorded workstream portfolio reference. This is the workstream-level value and is not a project expenditure or a new total of reassigned projects.

Measures & Operating Detail

MeasureValueType & meaningAttribution & operating context
Downtime OPEX Exposure per Repair Dollarapproximately 1.8 USD/USDScenario or Model Result
Modeled exposure ratio

Applies to: Cooling Financial Engineering and AFE Justification

Approximately $1.80 additional freight/labor OPEX exposure per $1 chiller repair cost.

Engineering scope and design basis

Added downtime financial-risk evidence to the cooling modernization business case.

Improved the cooling AFE narrative by showing how chiller repair exposure translated into forced-downtime OPEX through freight, tanker hauling, and overtime.

Cooling reliability was not only a repair-cost question; downtime created secondary freight, tanker, and labor exposure that changed the risk-adjusted economics of repair versus replacement.

Added financial/risk modeling showing approximately $1.80 OPEX exposure for every $1 in chiller repair cost, driven by freight, tanker hauling, and overtime from forced downtime; added temporary tanker operations between 2018 and 2020.

Historical temporary tanker operating-cost exposure was evaluated during 2018-2020.

Improved cooling capital justification, measured by $1.80 OPEX exposure per $1 chiller repair and $231Ktemporary tanker operations between 2018 and 2020, by quantifying forced-downtime freight, tanker, and overtime impacts in the repair-vs-replace model.

Improved financial-risk visibility for cooling reliability decisions.

$1.80 OPEX exposure per $1 repair; temporary tanker operations from 2018-2020.

Actions, Methods & Controls

ACTIVITIES IN CONTEXT

Additional Technical Detail

Roles & contributions
  • Project Ownership

    Full lifecycle project ownership

    Owned the full project lifecycle: capital planning and prioritization, need definition, feasibility and scope development, engineering and AFE justification, procurement and vendor coordination, construction sequencing and field oversight, commissioning, turnover, and post-startup support. Connected operating requirements with technical scope, funding decisions, execution readiness, and the needs of operations and maintenance.

Workstream context
Additional technical detail
Explore 2 detail records
  • Historical operating-cost exposure

    Added temporary tanker operations between 2018 and 2020.

  • Historical operating-cost exposure

    Temporary tanker operating-cost exposure was evaluated during 2018-2020.

All portfolio connections
Project ownership and delivery context

Owned the full project lifecycle: capital planning and prioritization, need definition, feasibility and scope development, engineering and AFE justification, procurement and vendor coordination, construction sequencing and field oversight, commissioning, turnover, and post-startup support. Connected operating requirements with technical scope, funding decisions, execution readiness, and the needs of operations and maintenance.

modeled demand and the roughly 78-ton peak thermal deficit, coordinated pumps and recirculation, and developed chiller staging and runtime balancing. Operating visibility and process-load monitoring connected the three 160-ton production chillers with the way the plant used cooling capacity.

Related methods and applications
Related analysis and application artifacts
Connected collections

WHAT COMES NEXT

Complex Challenge?
Let’s Work Through It.

Engineering leadership, capital projects, and independent consulting.

Start a conversation ↗