
 System
TECHNICAL DIRECTORY
Follow the Systems.
Find the Detail.
Explore workstreams, equipment, technical systems, and the complete 248-entry artifact directory.
Technical Systems
SystemSystem SystemSystem
 System
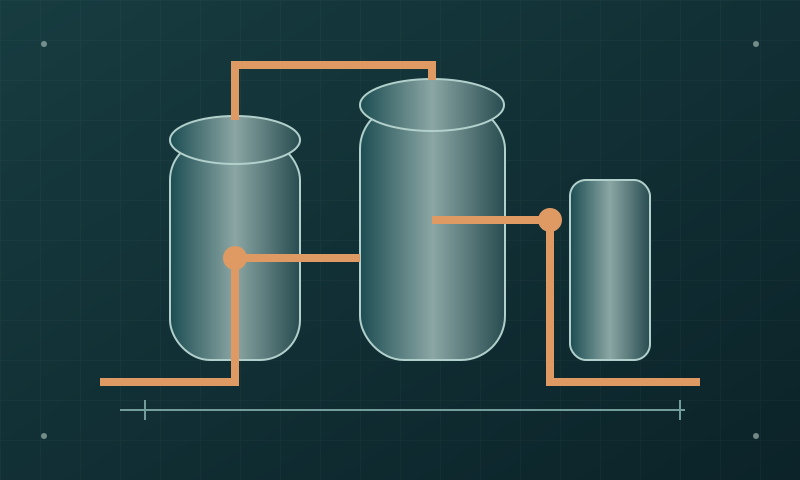 System
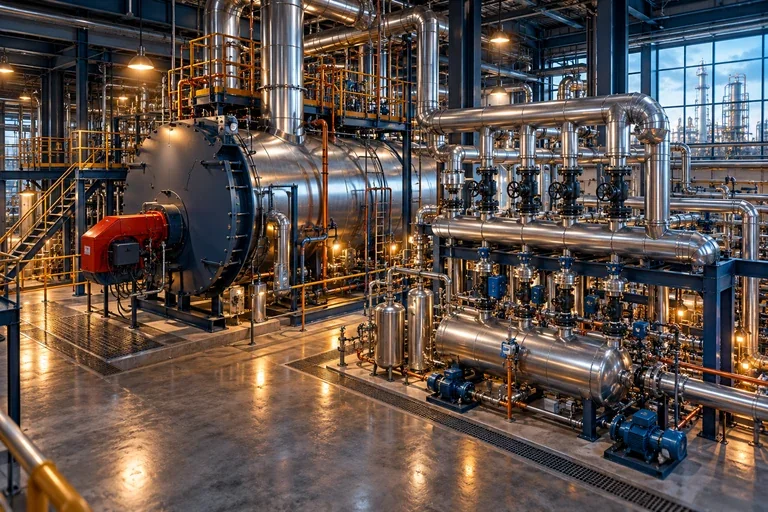 System
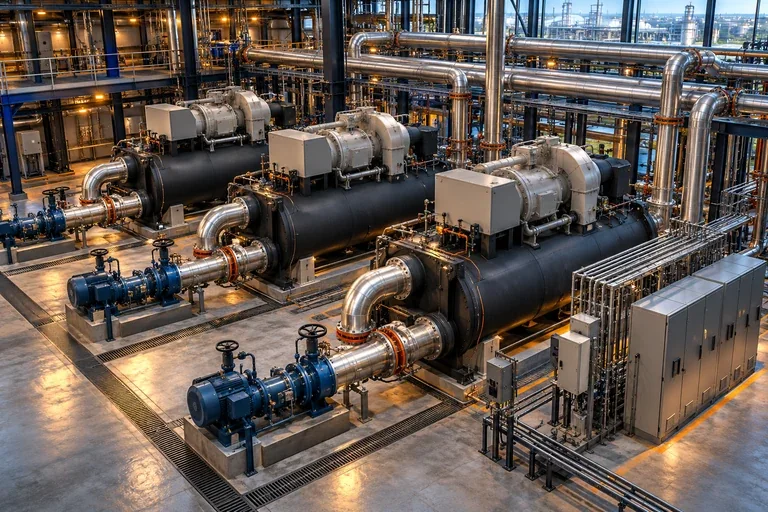 System
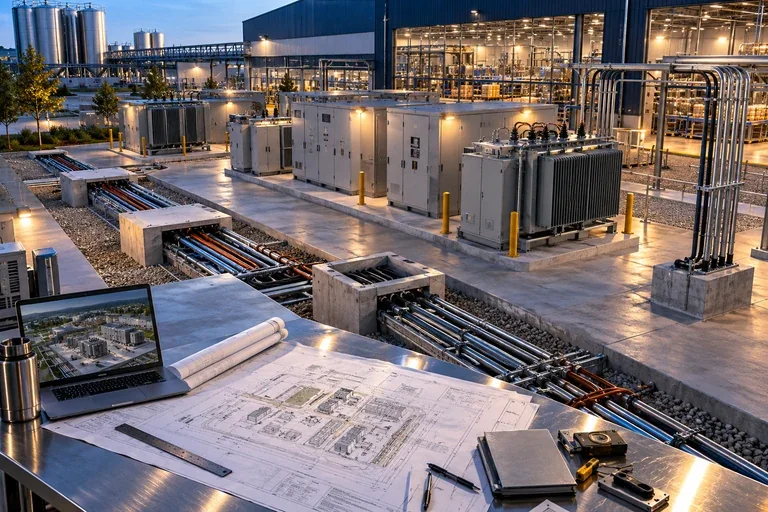 System
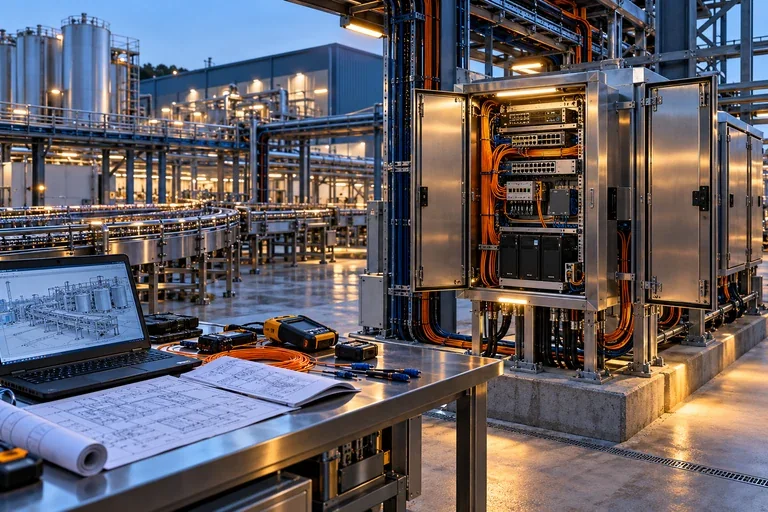 SystemSystemSystemSystemSystemSystemSystem
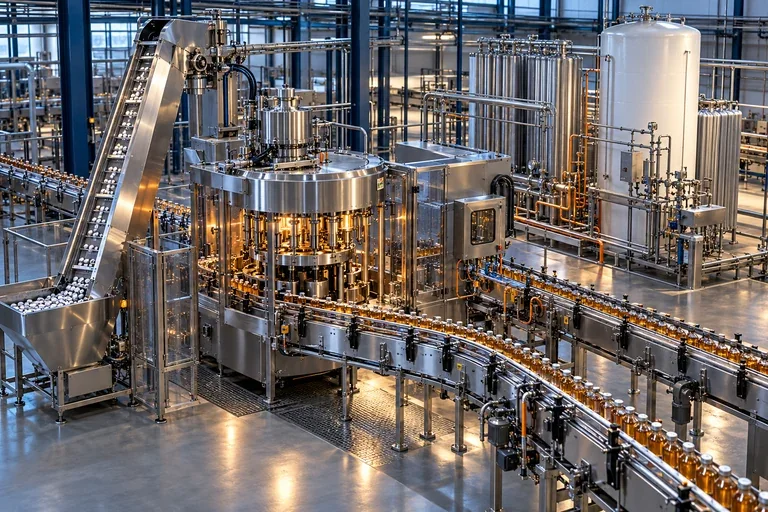 System
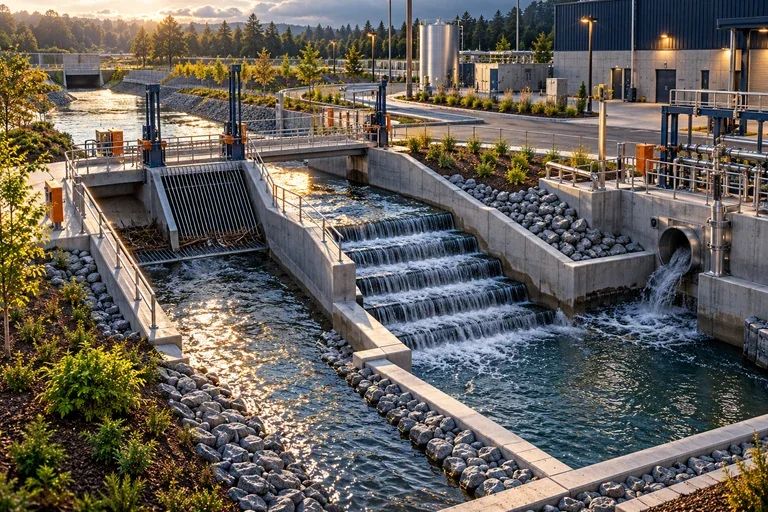 SystemSystemSystemSystemSystemSystemSystem
 System
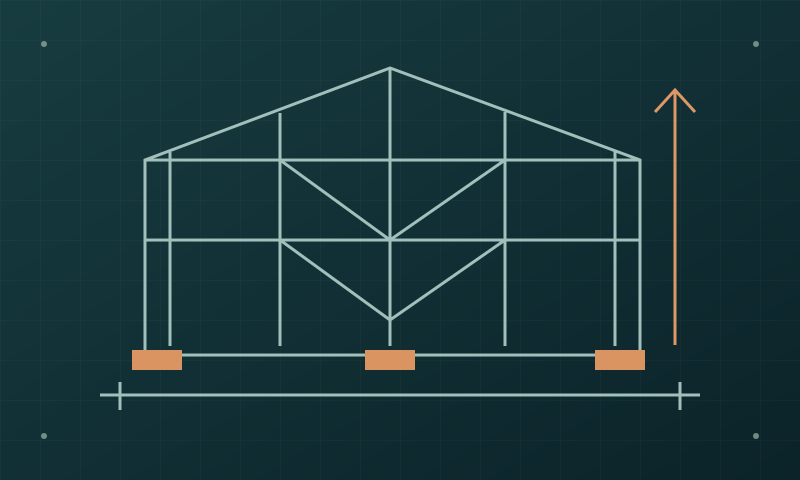 SystemSystemSystem
No matching entries. Try another term.
Named Equipment
AssetAssetAssetAssetAssetAssetAssetAssetAssetAssetAssetAssetAssetAssetAssetNo matching entries. Try another term.
Artifact Directory
 AC-001AC-002AC-003AC-004
 AC-005AC-006
 AC-007AC-008AC-009AC-010AC-011AC-012
 AC-013
 AC-014AC-015
 AC-016AC-017
 AC-018AC-019
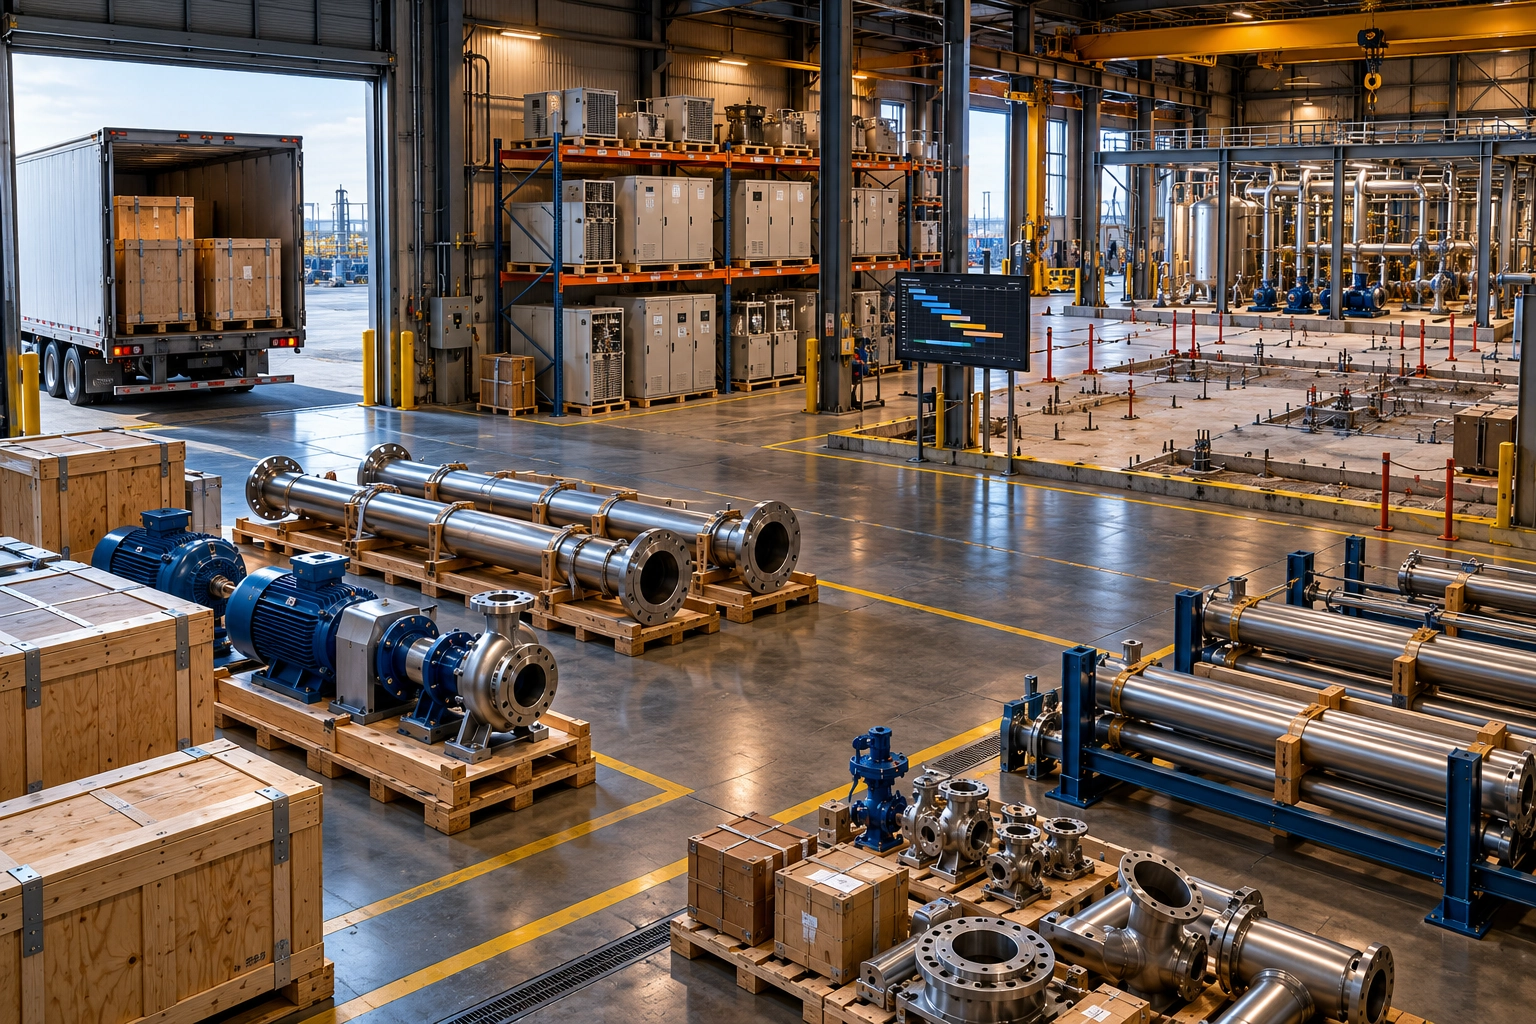 AC-020AC-021
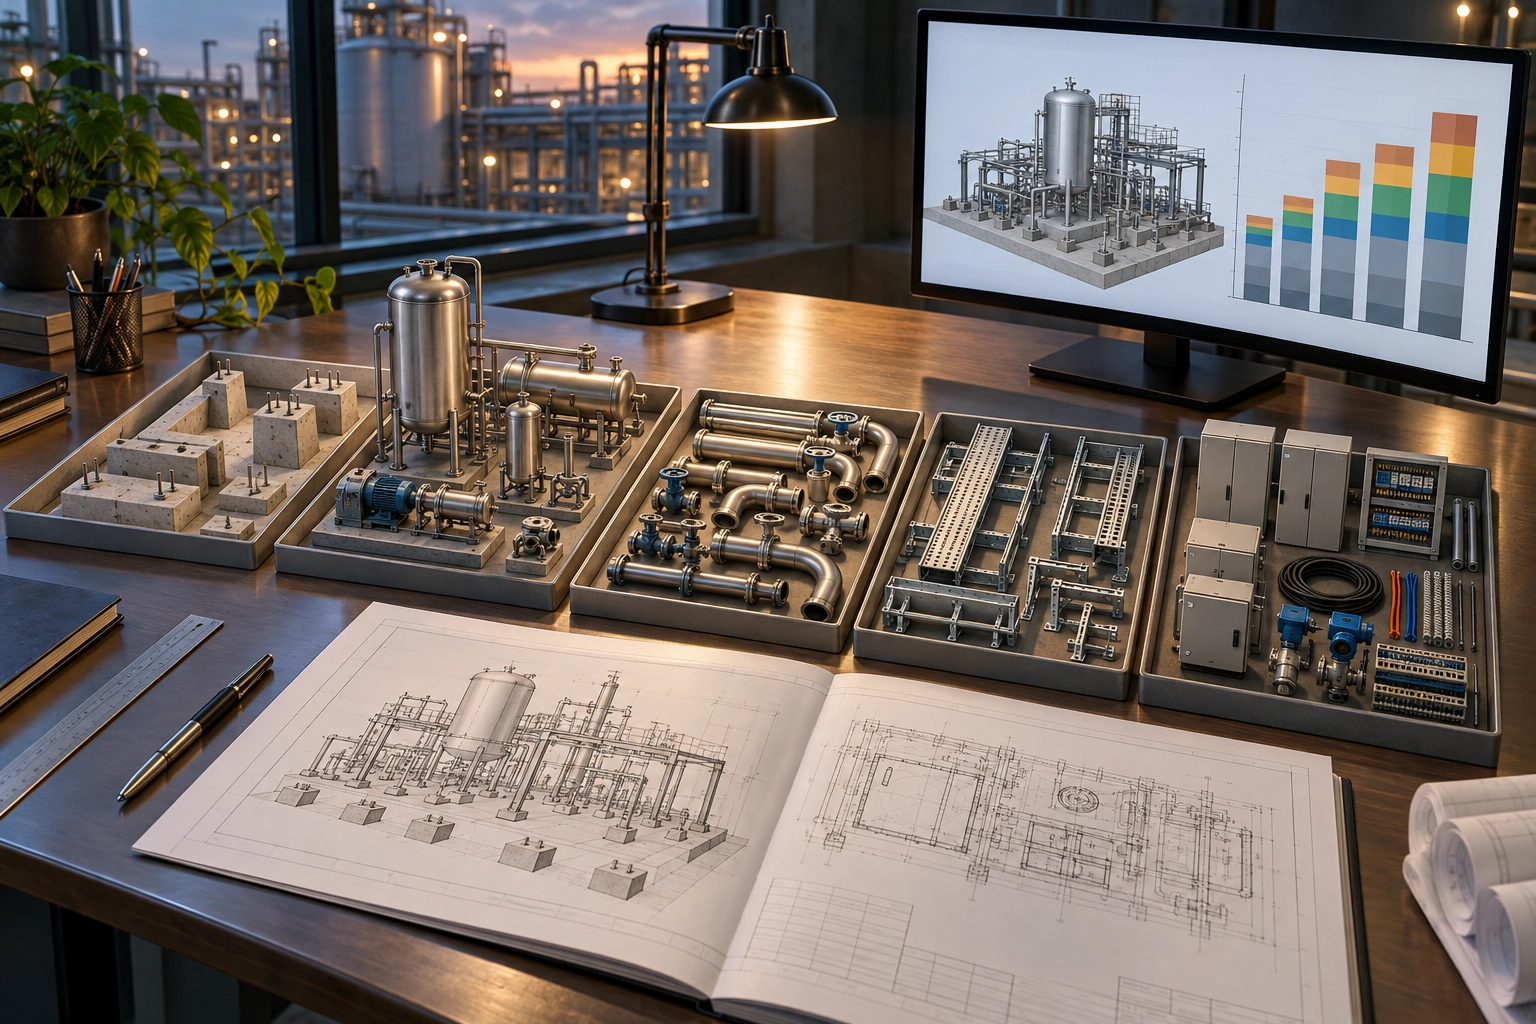 AC-022AC-023AC-024
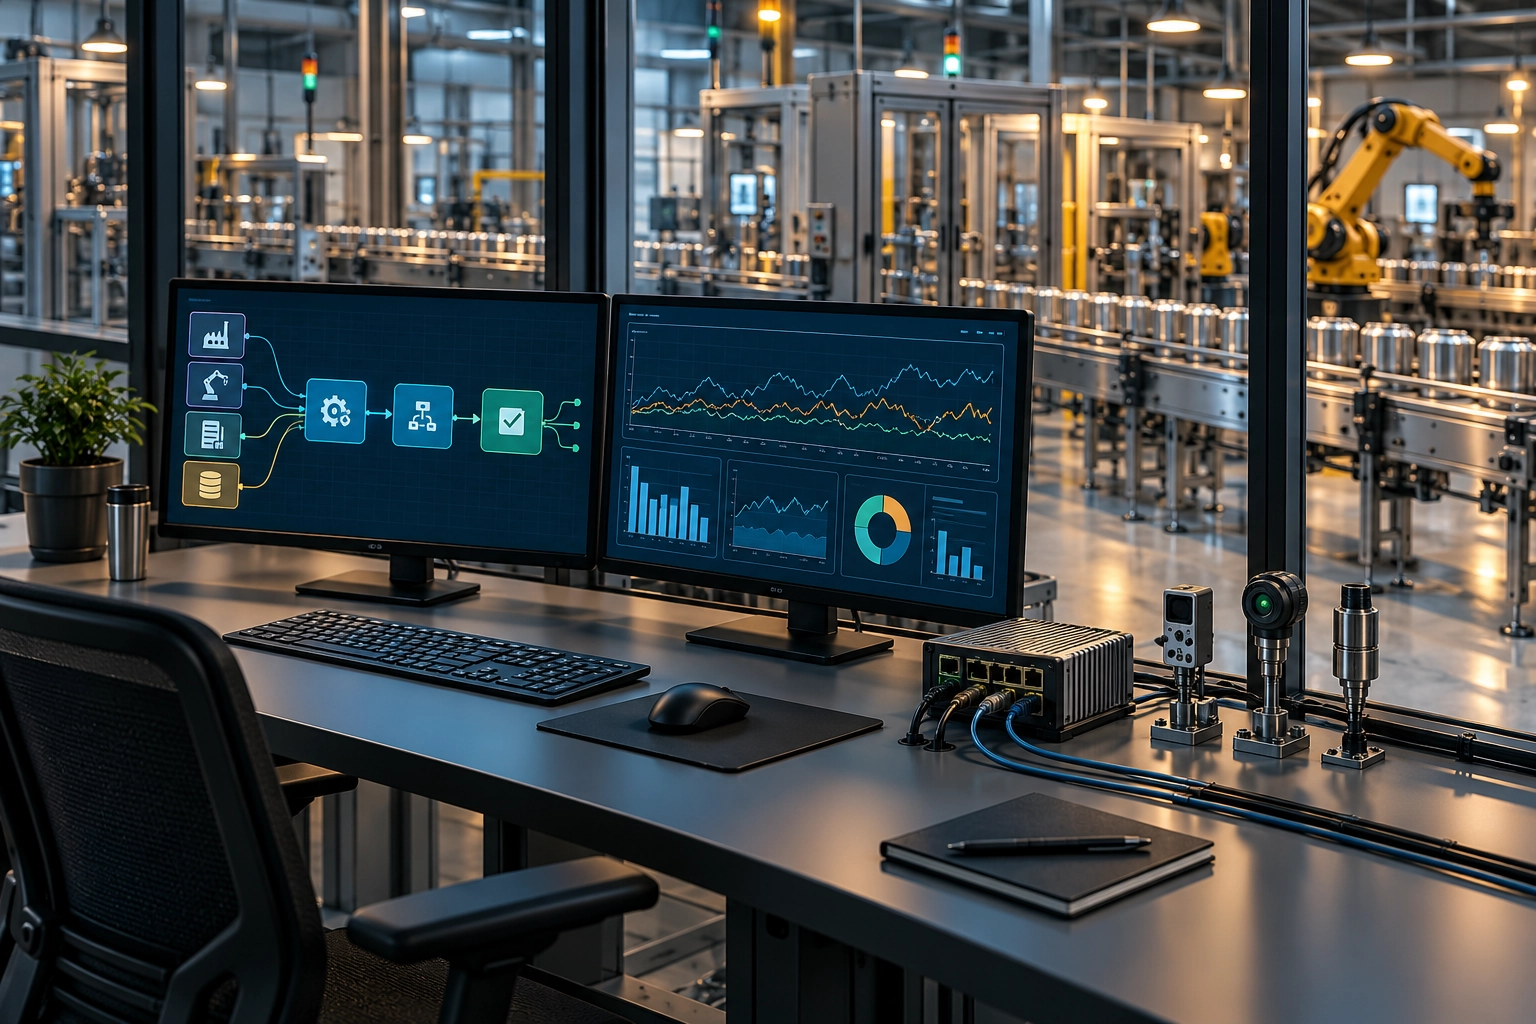 AC-025AC-026
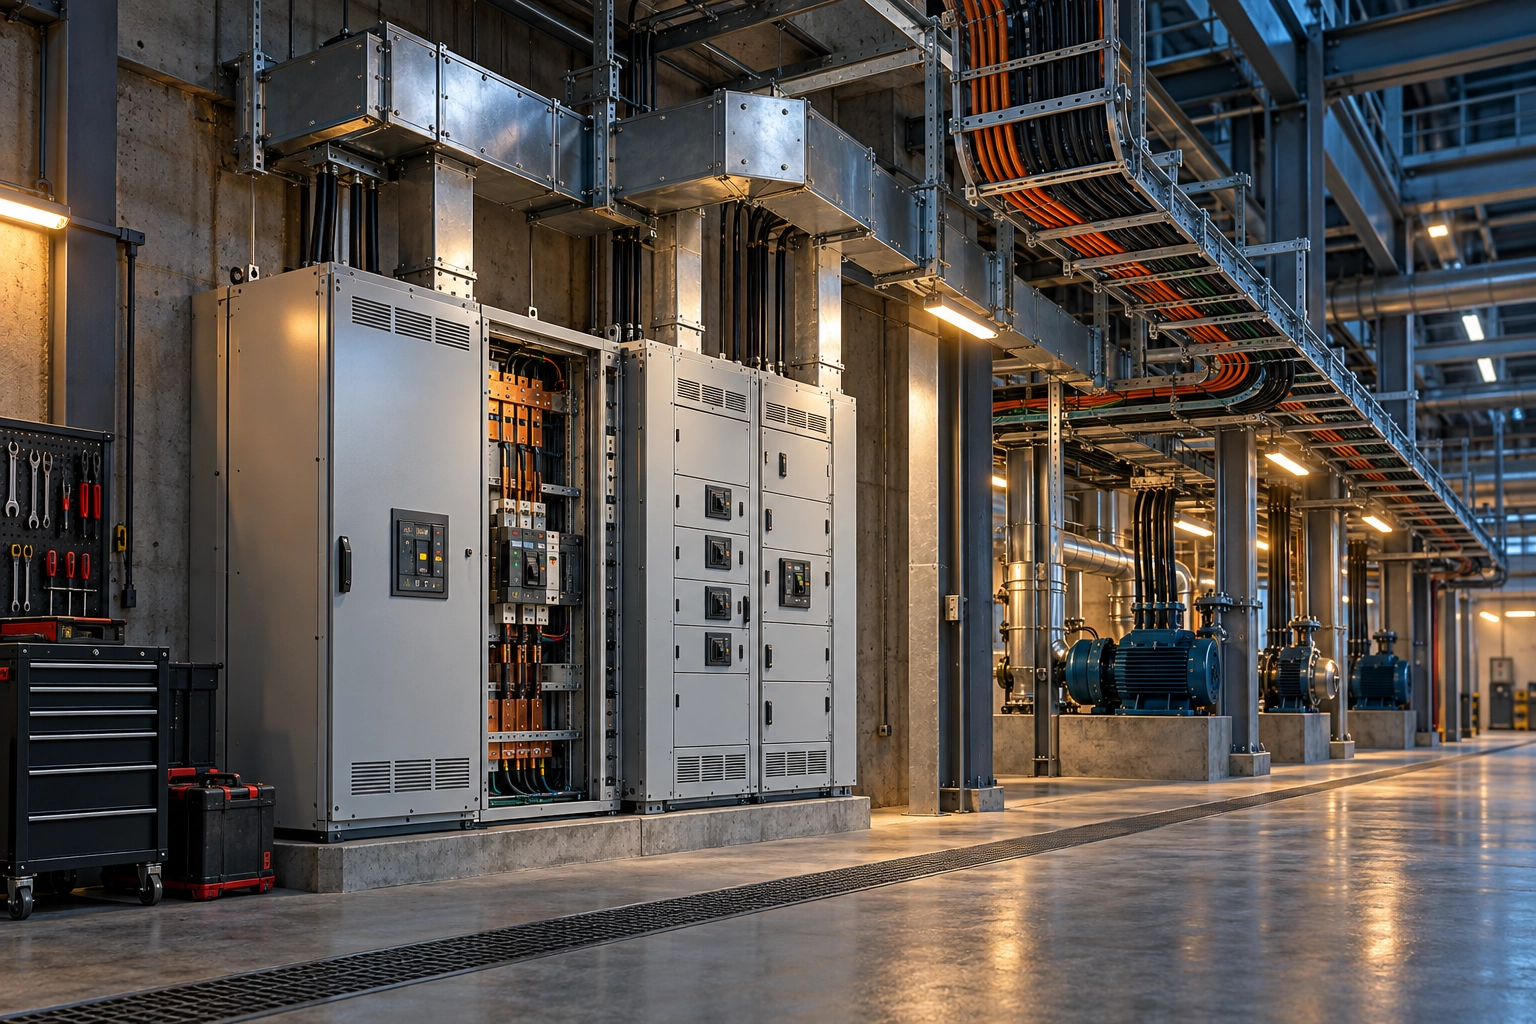 AC-027
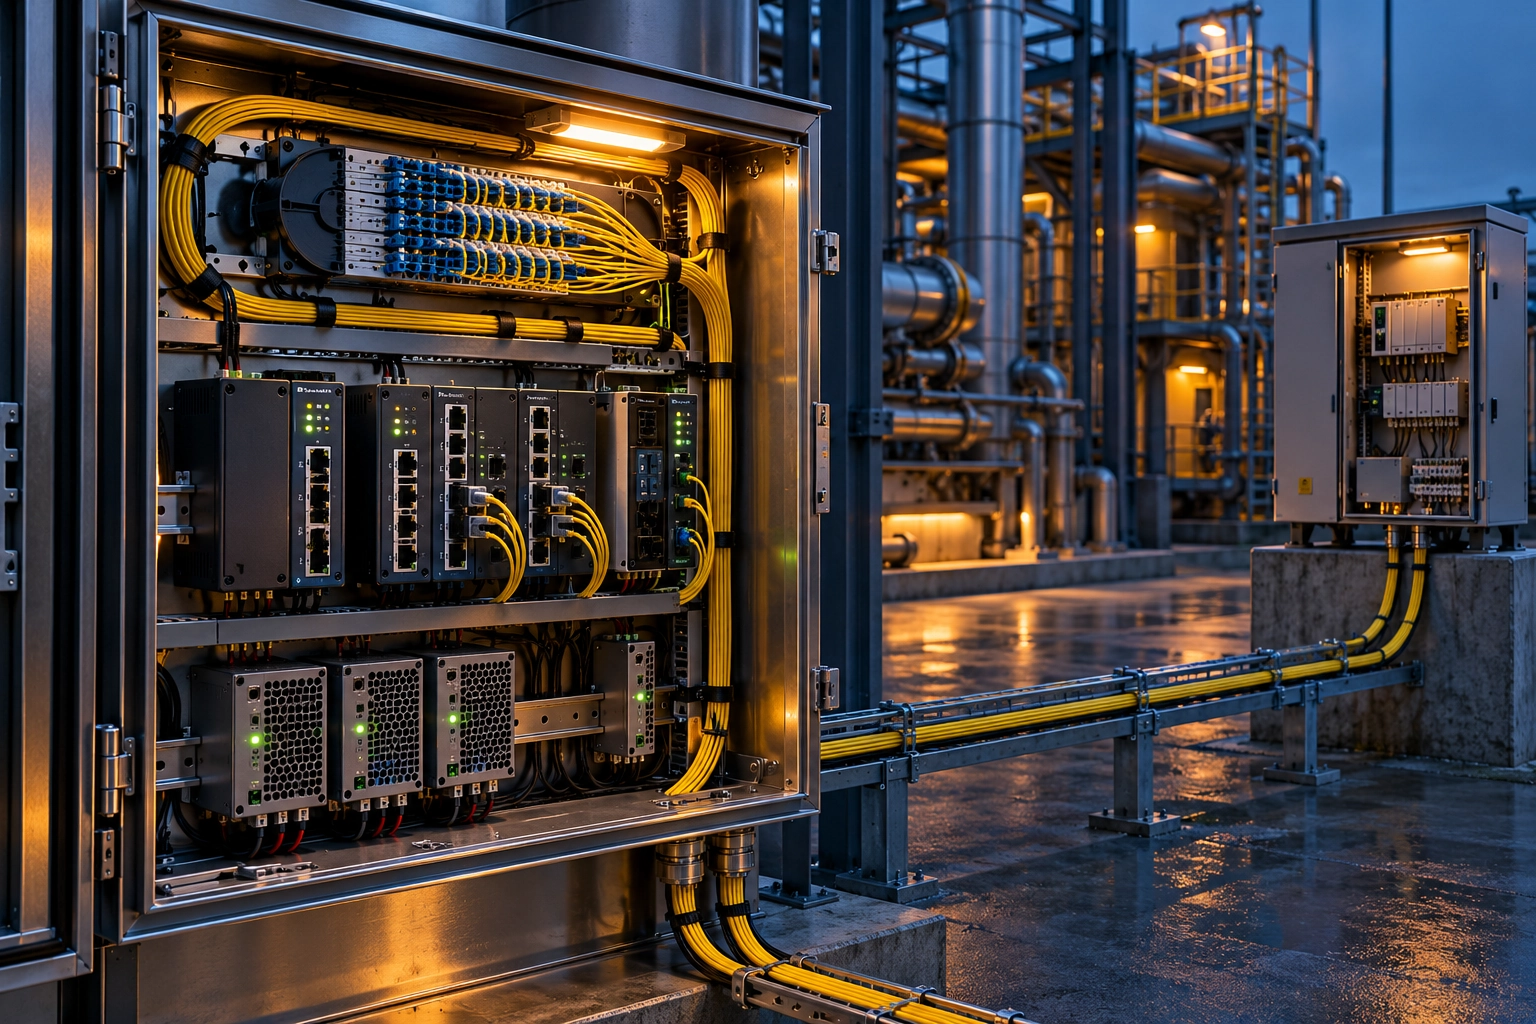 AC-028AC-029
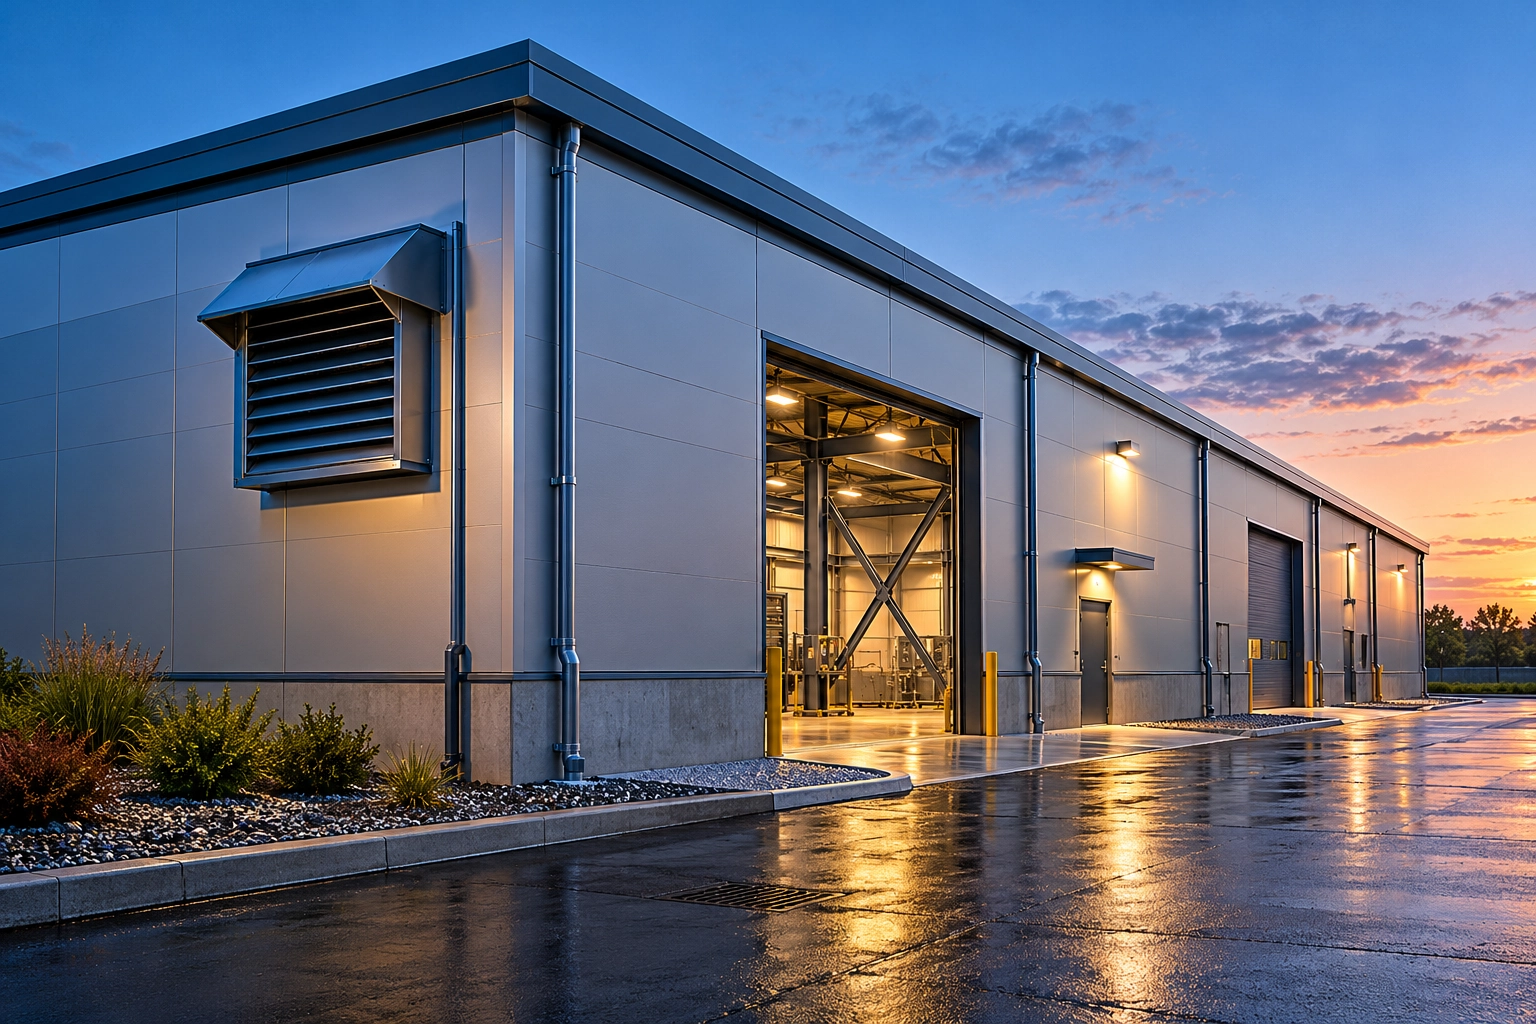 AC-030AC-031AC-032AC-033
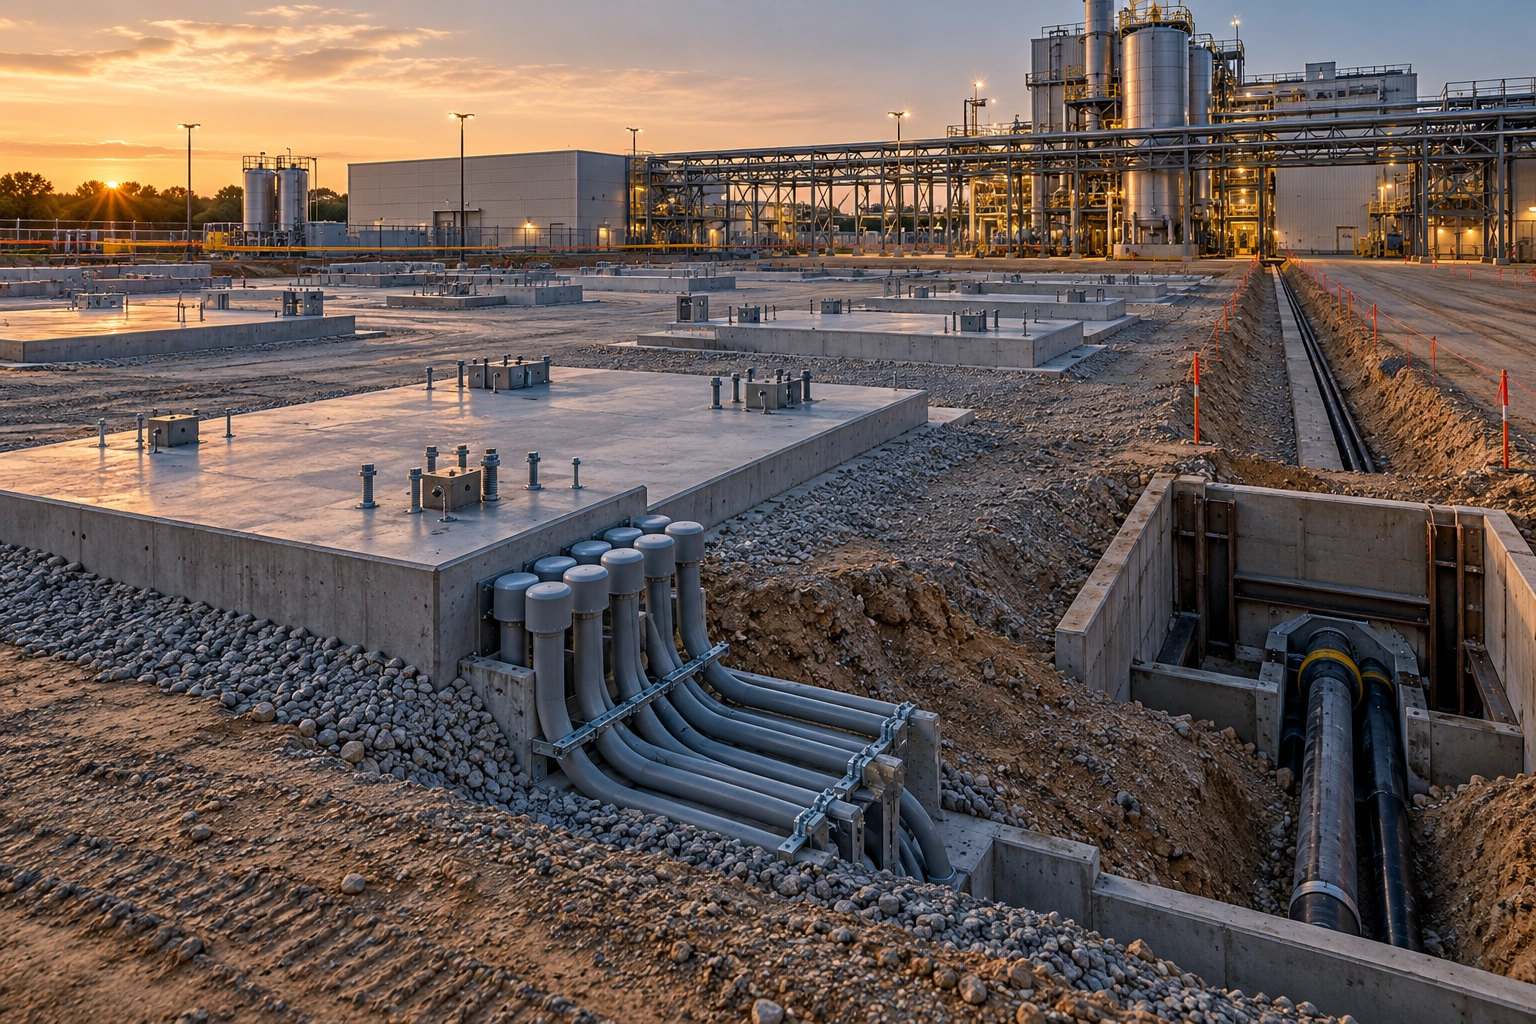 AC-034AC-035
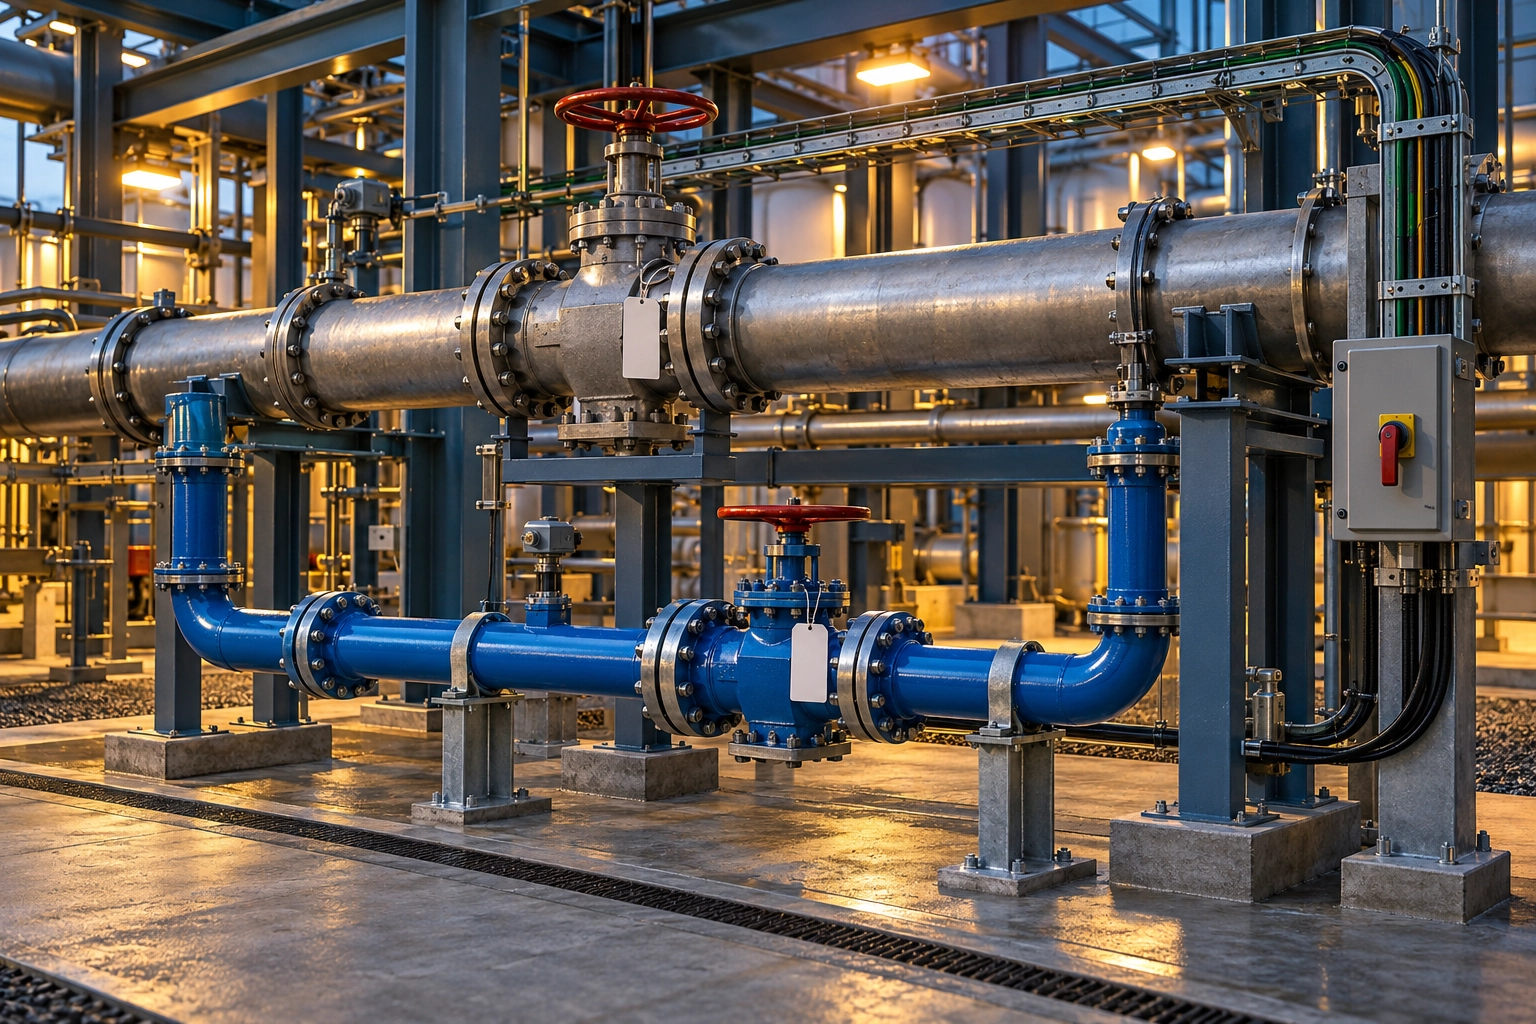 AC-036AC-037AC-038AC-039
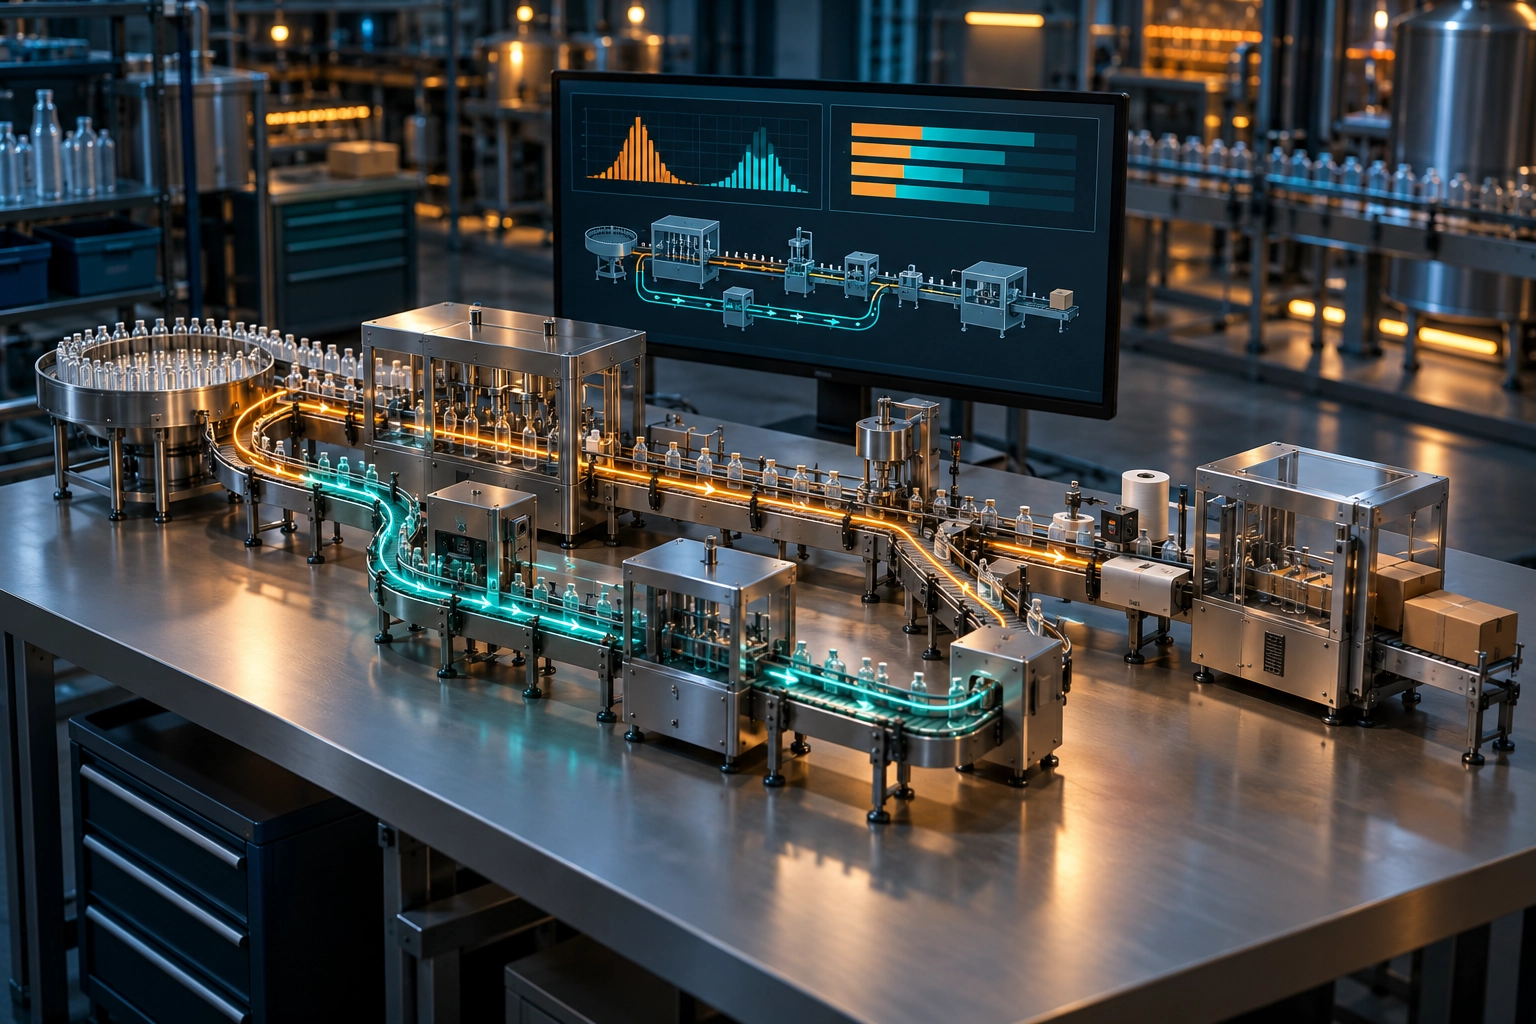 AC-040AC-041
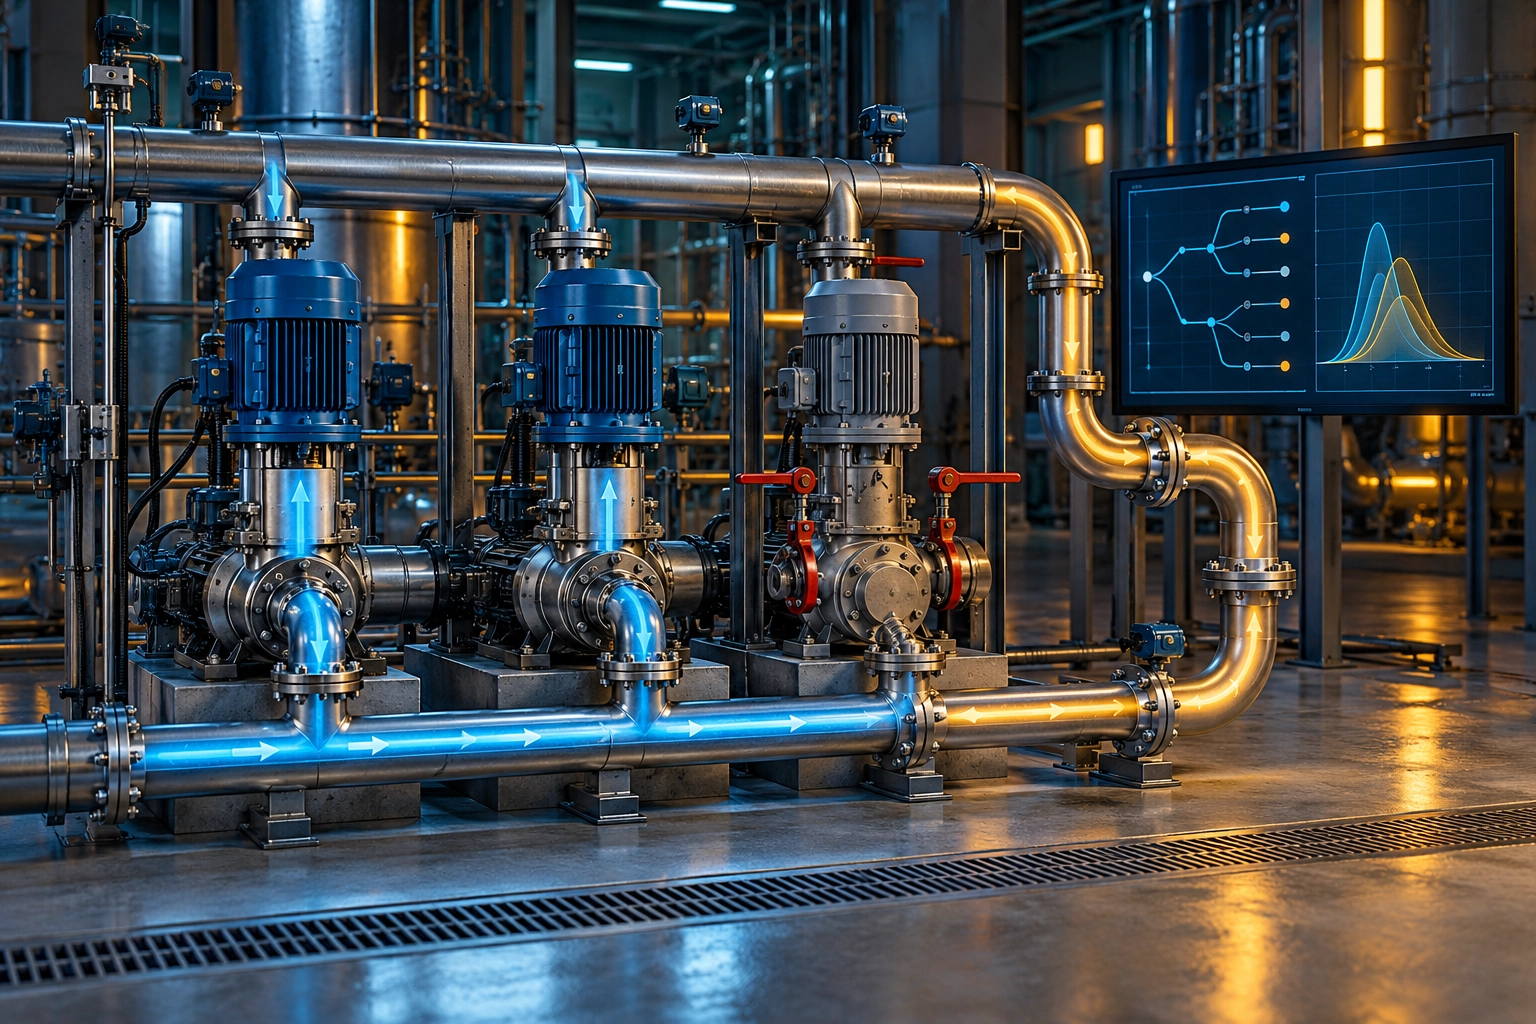 AC-042AC-043
 AC-044
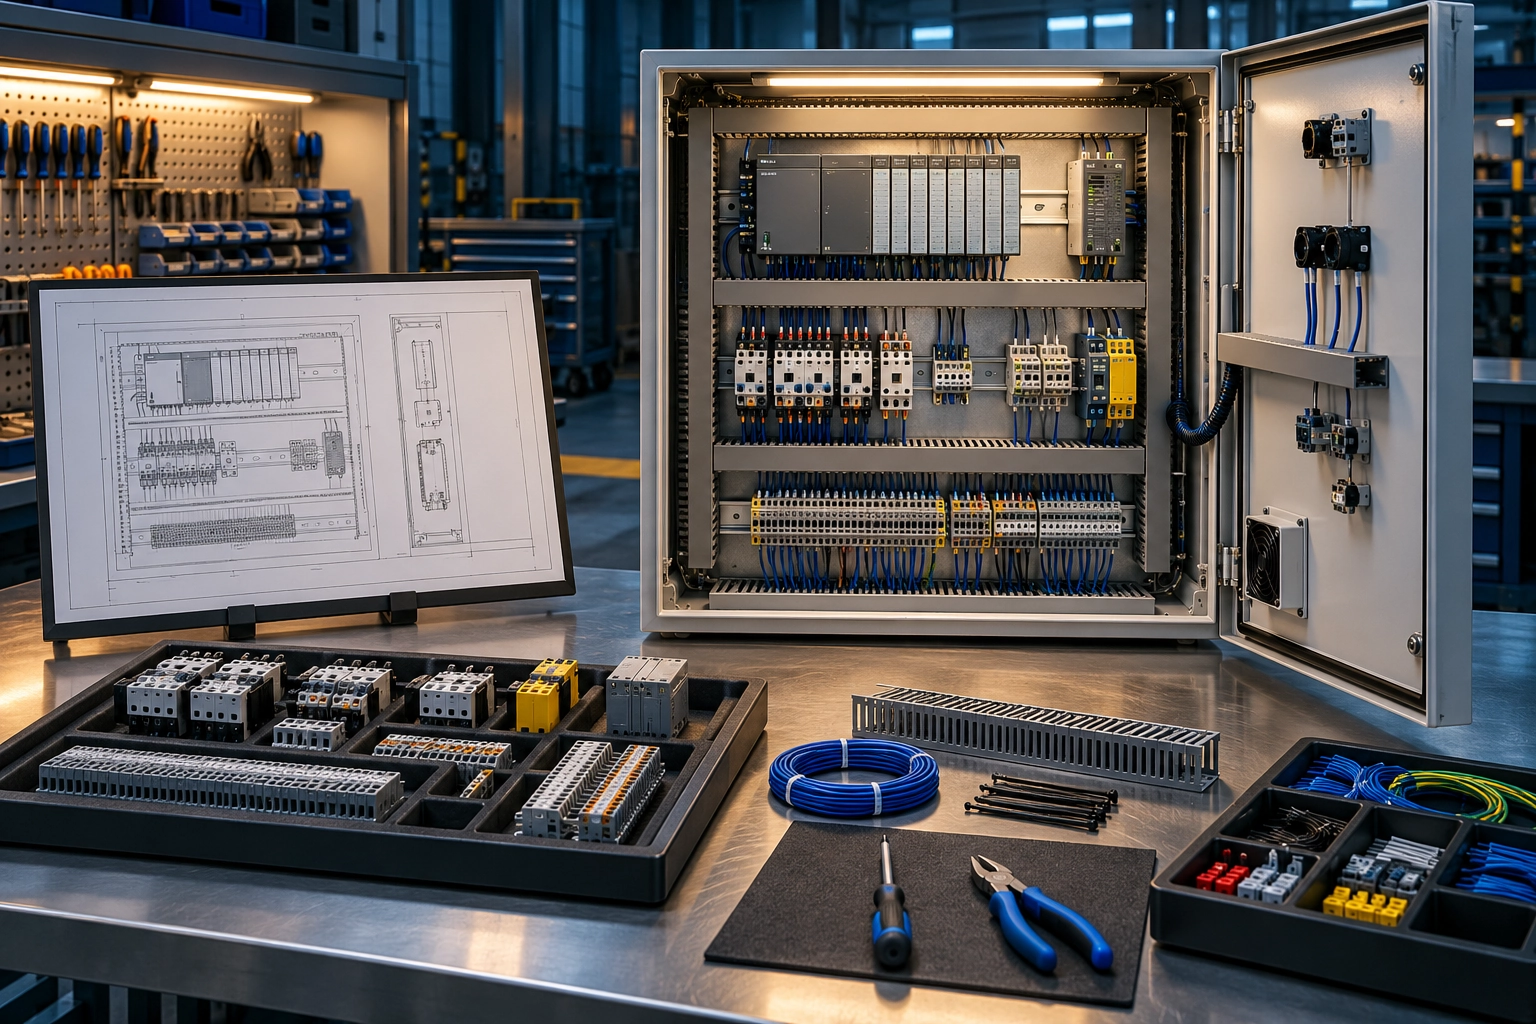 AC-045AC-046AC-047
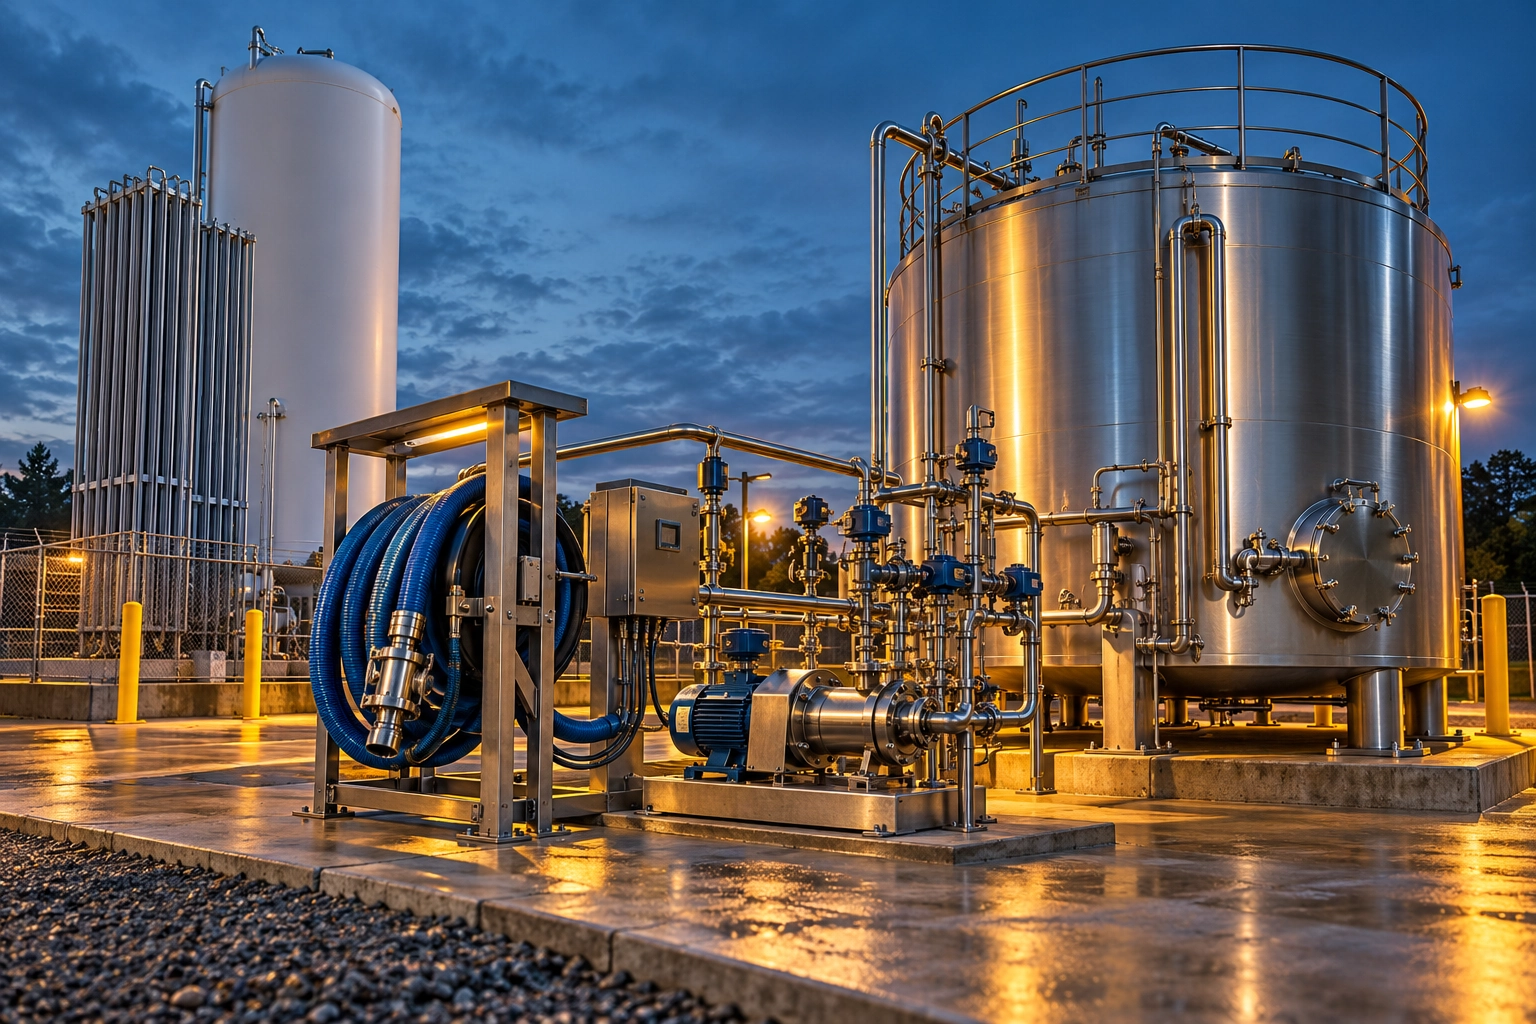 AC-048AC-049AC-050AC-051
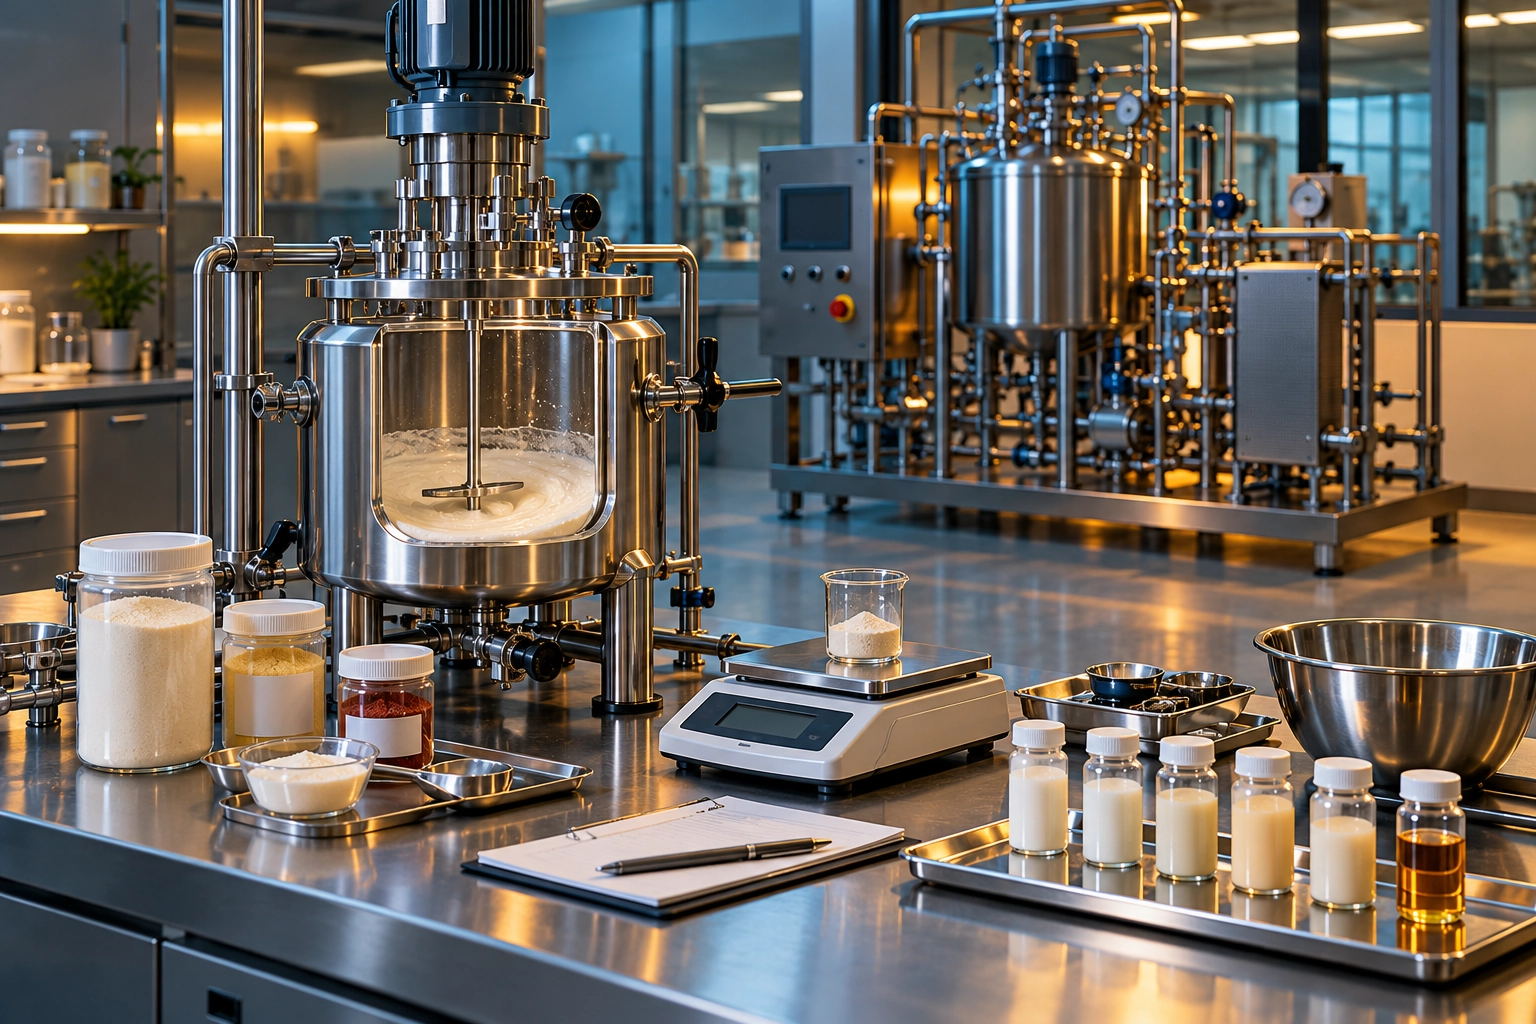 AC-052AC-053AC-054
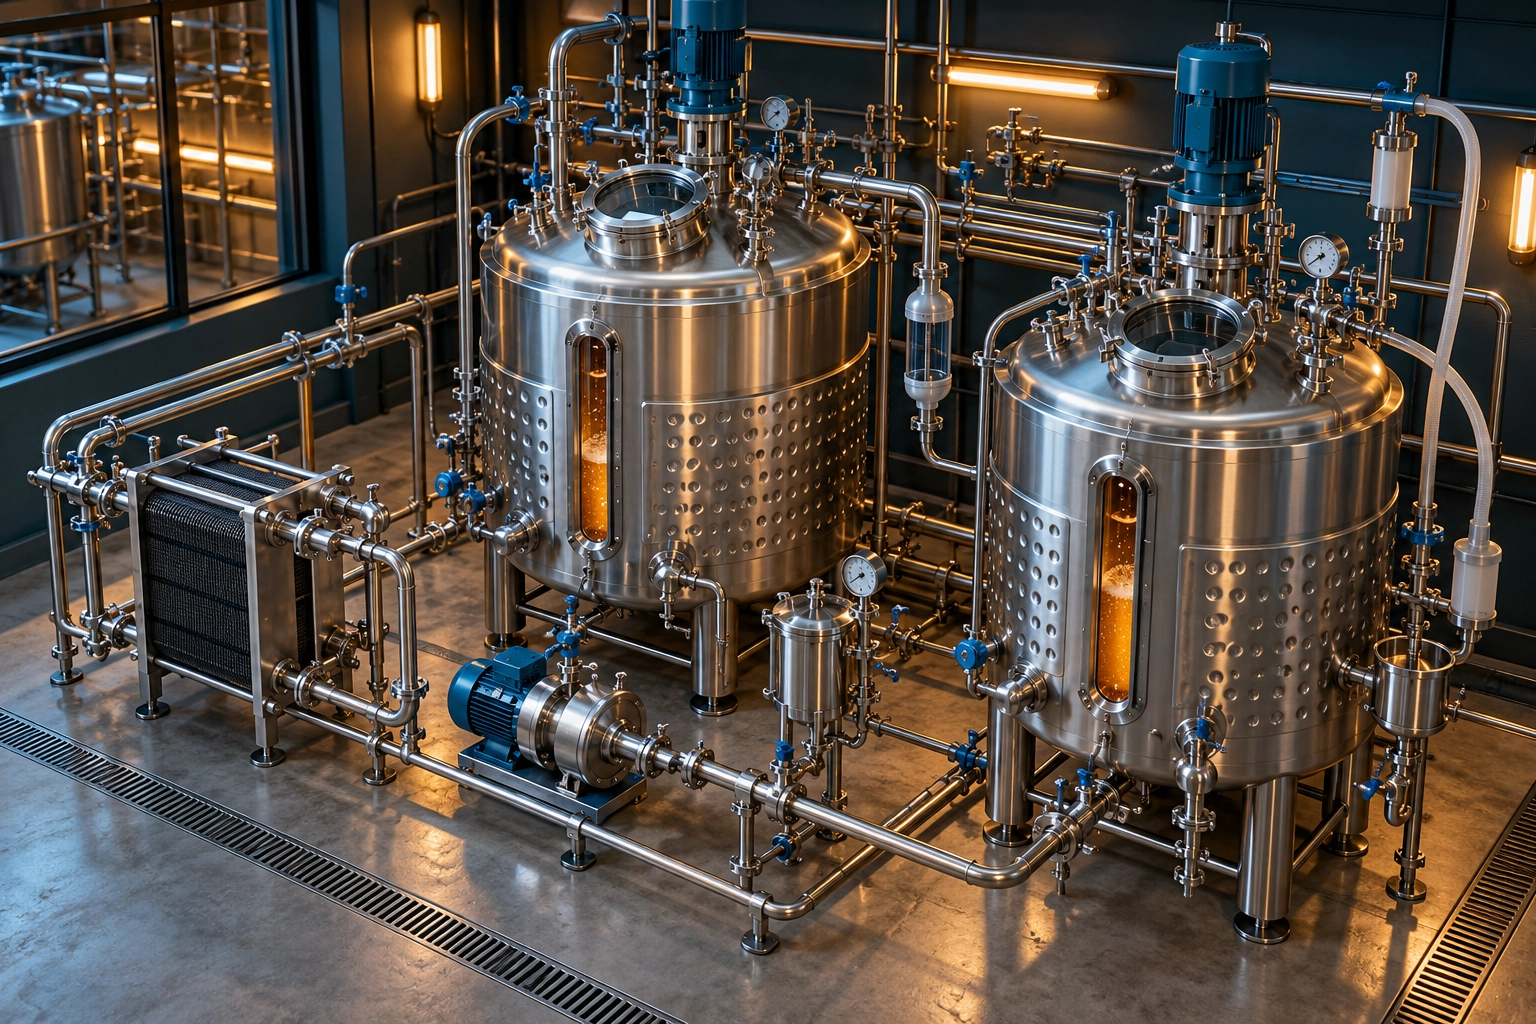 AC-055
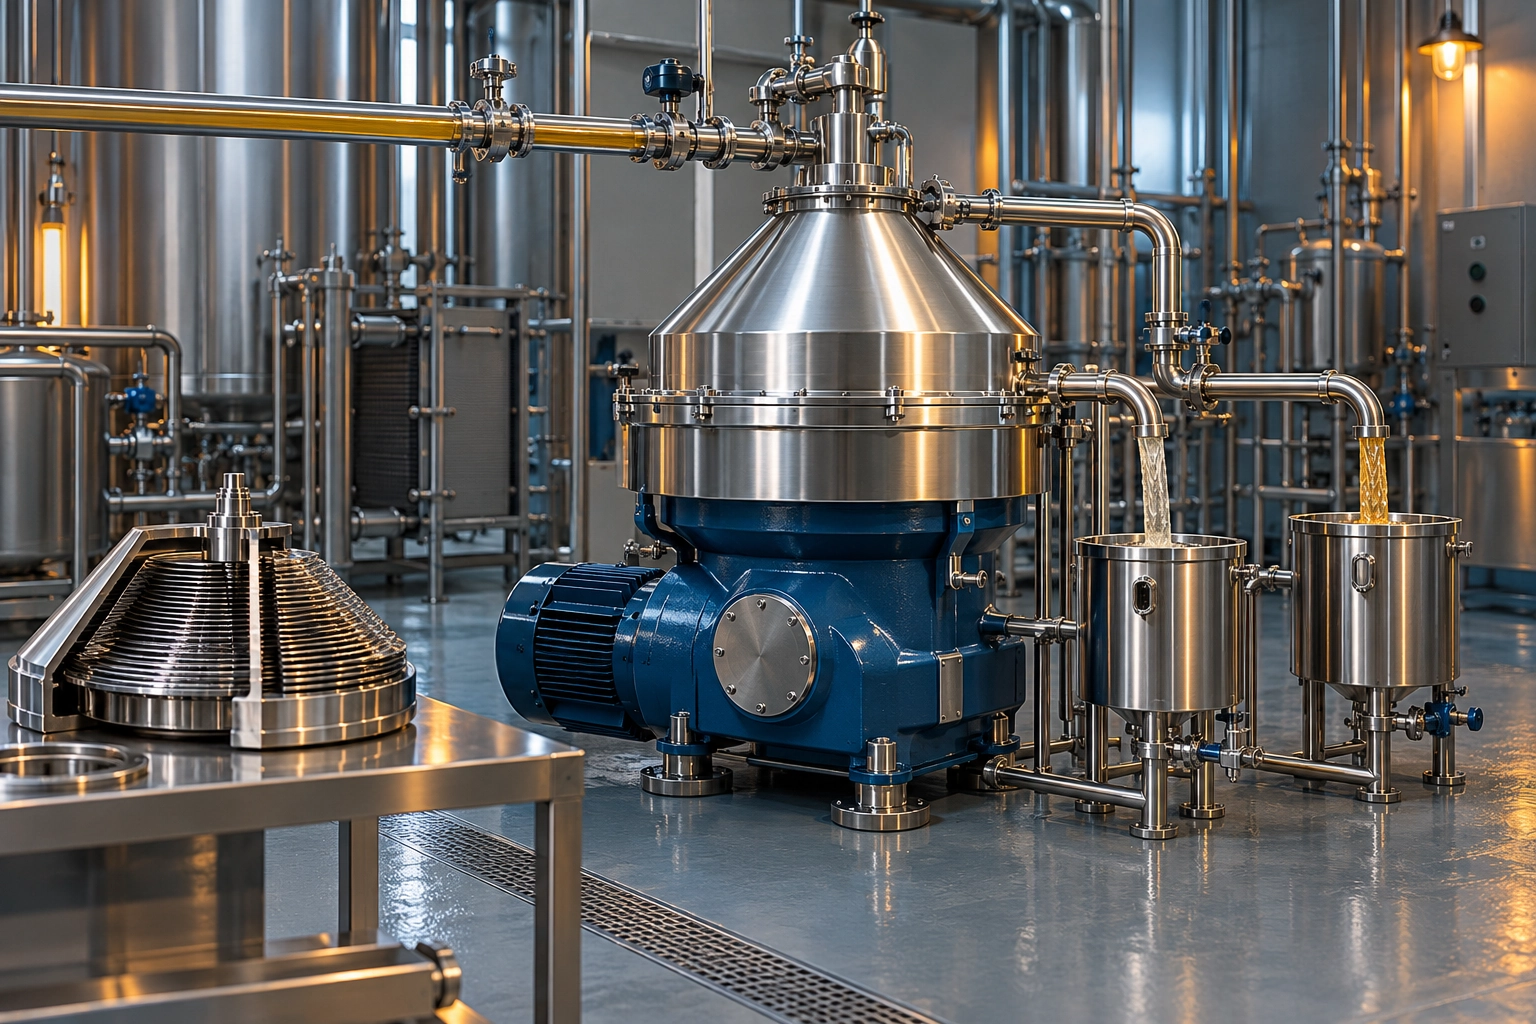 AC-056
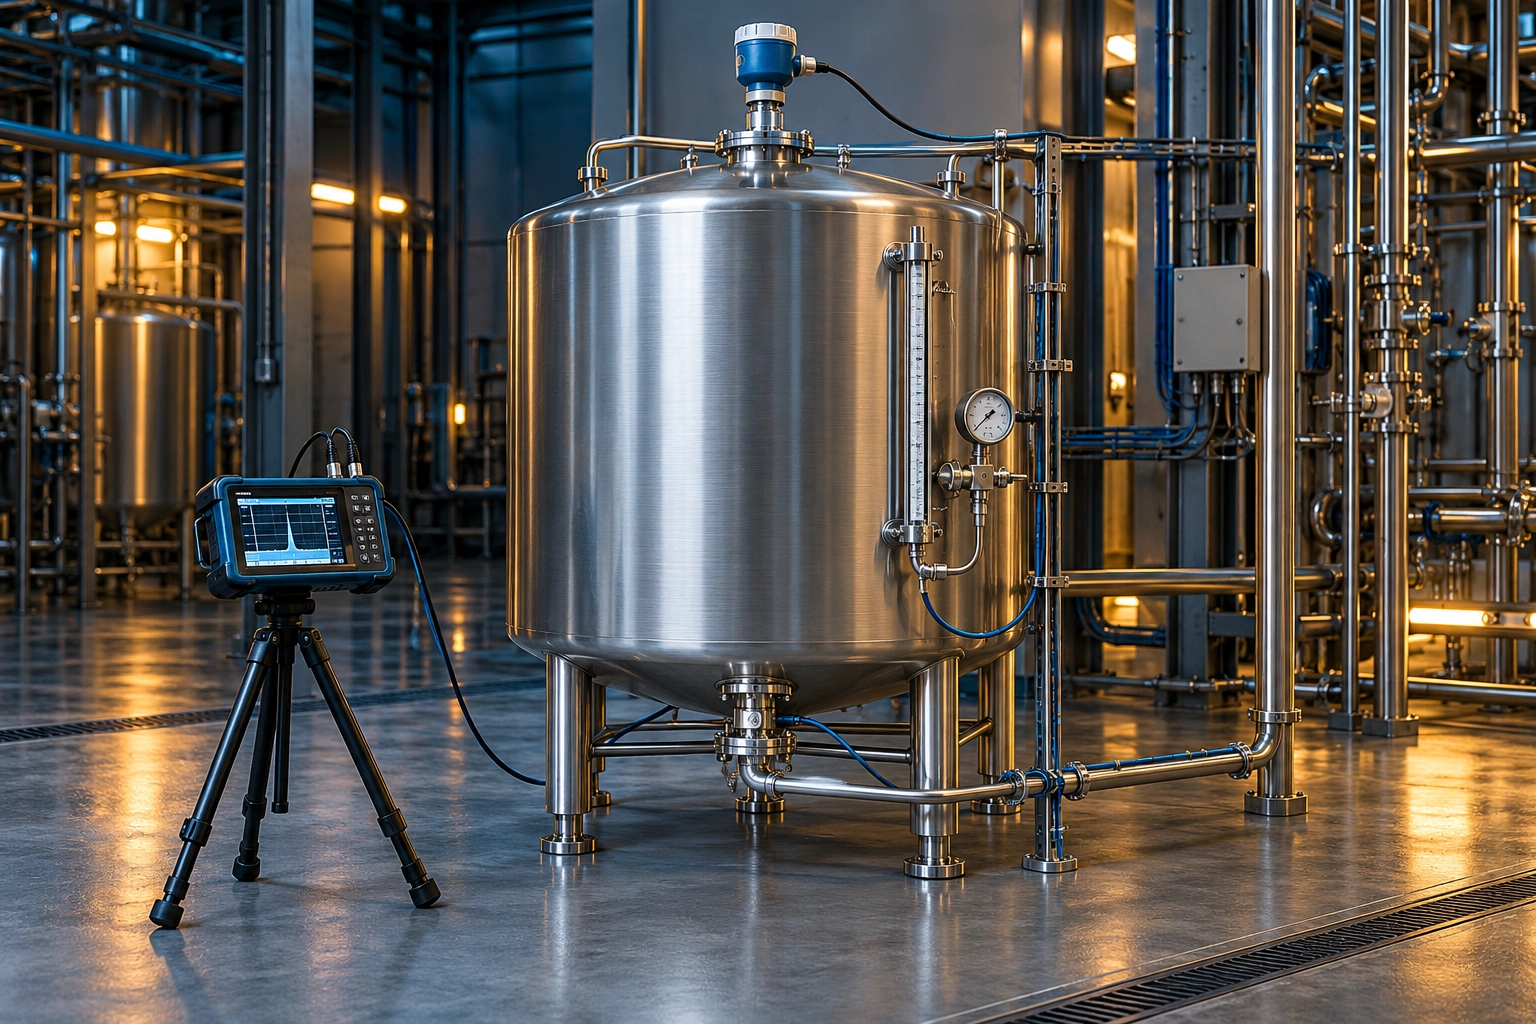 AC-057AC-058AC-059AC-060
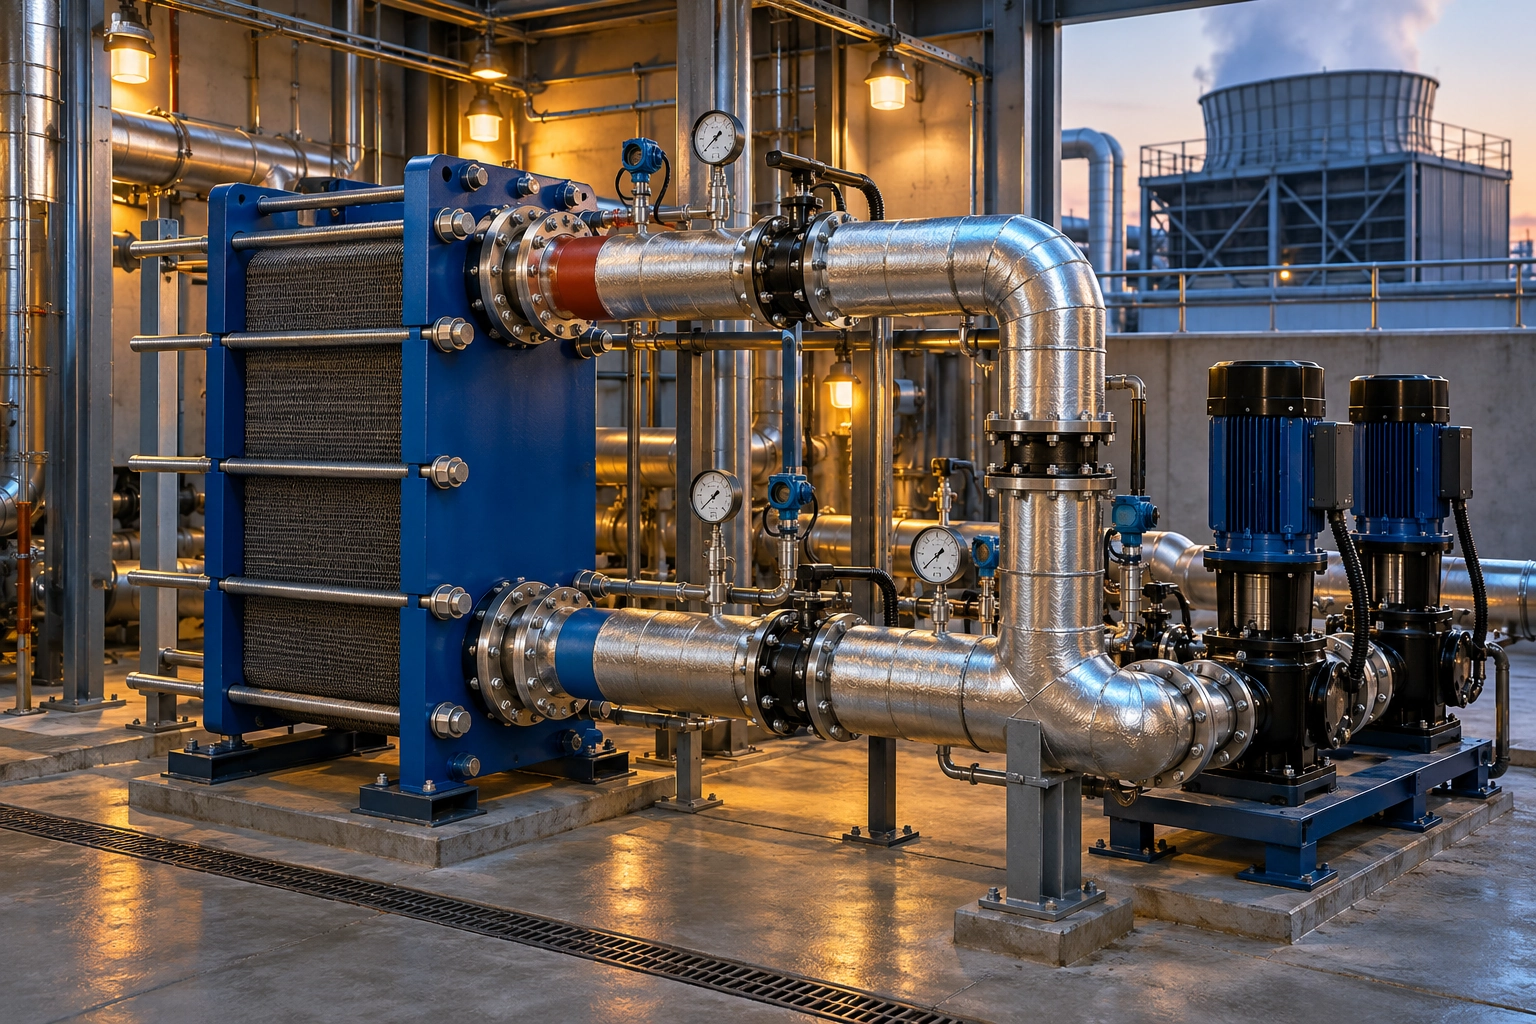 AC-061
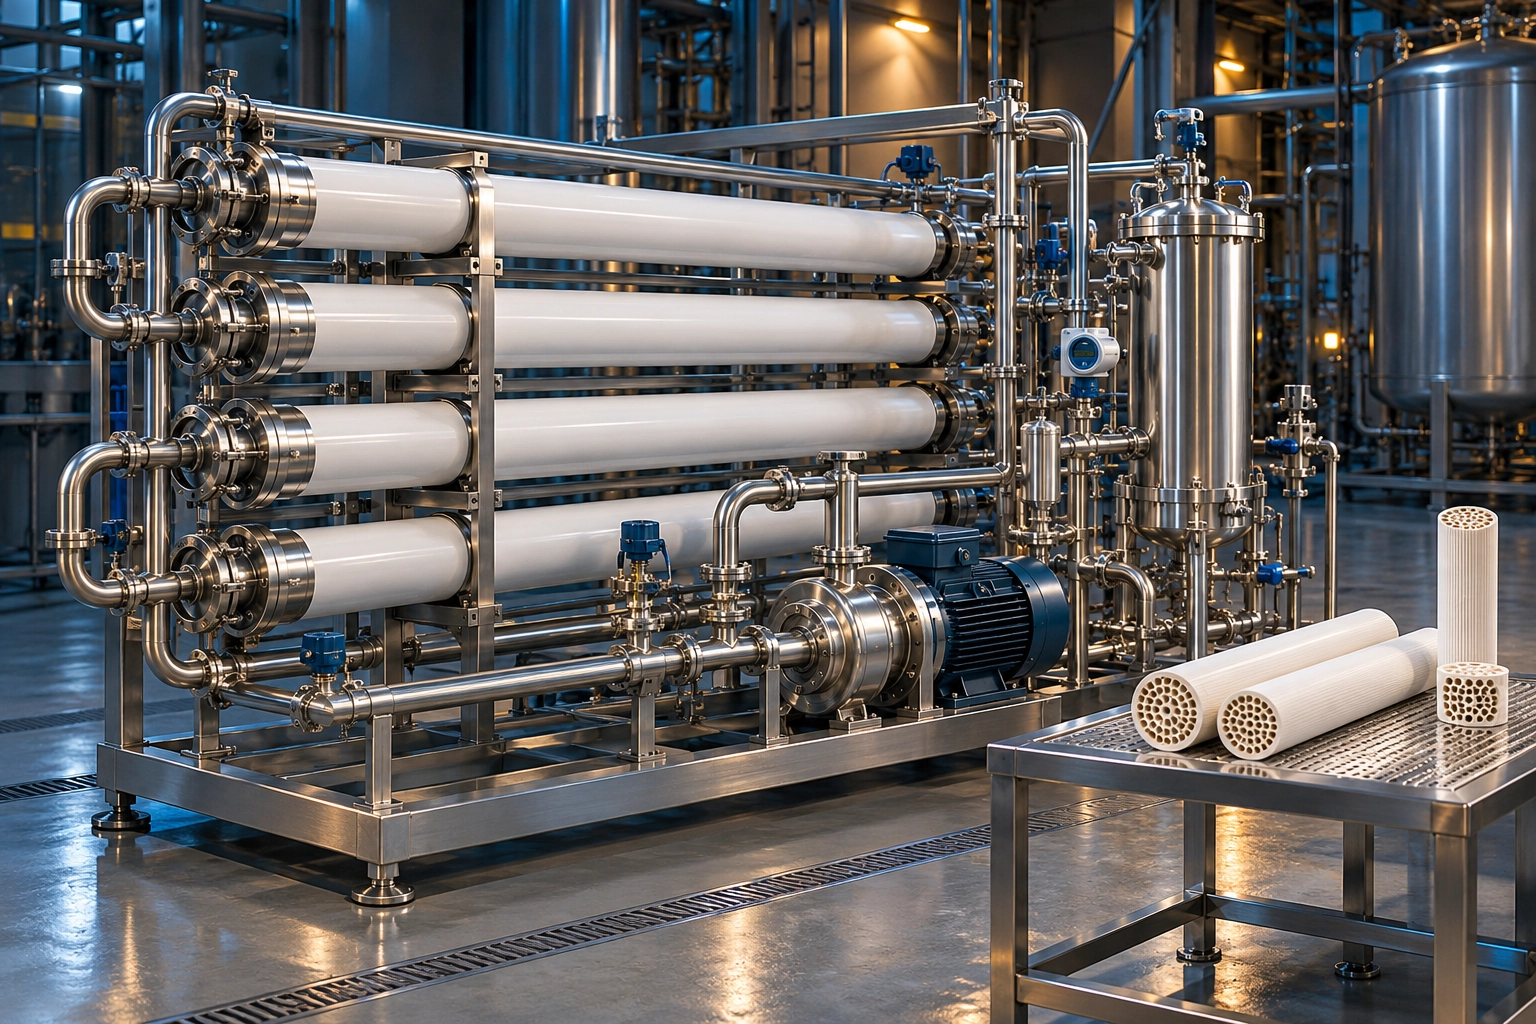 AC-062
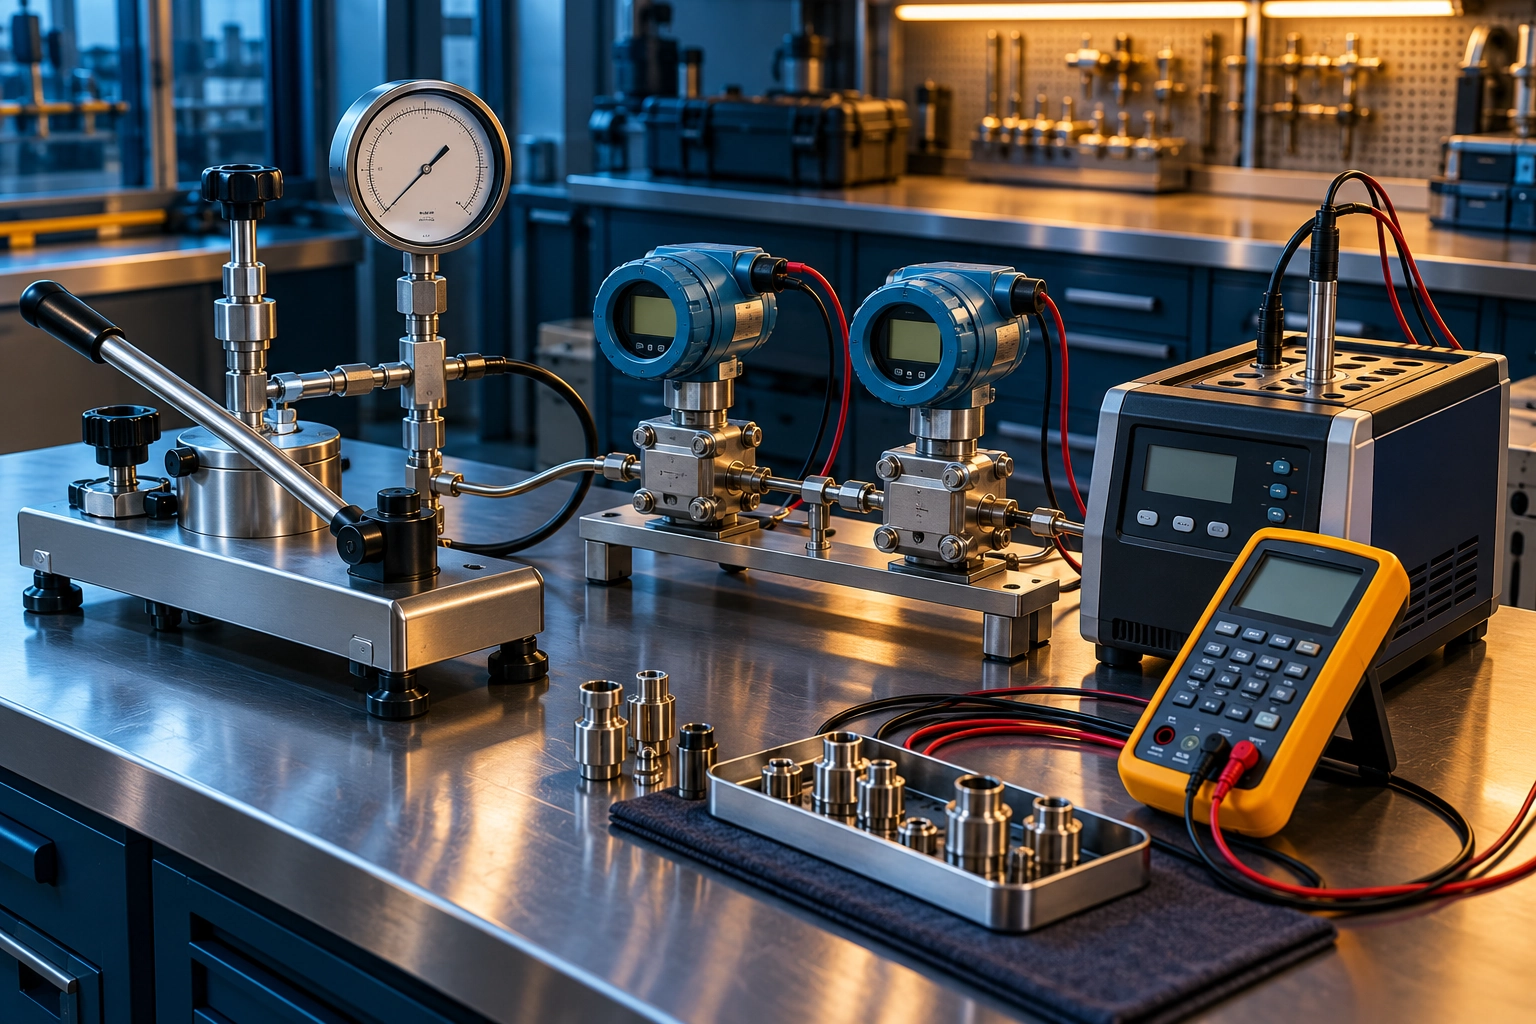 AC-063AC-064AC-065AC-066AC-067AC-068AC-069AC-070
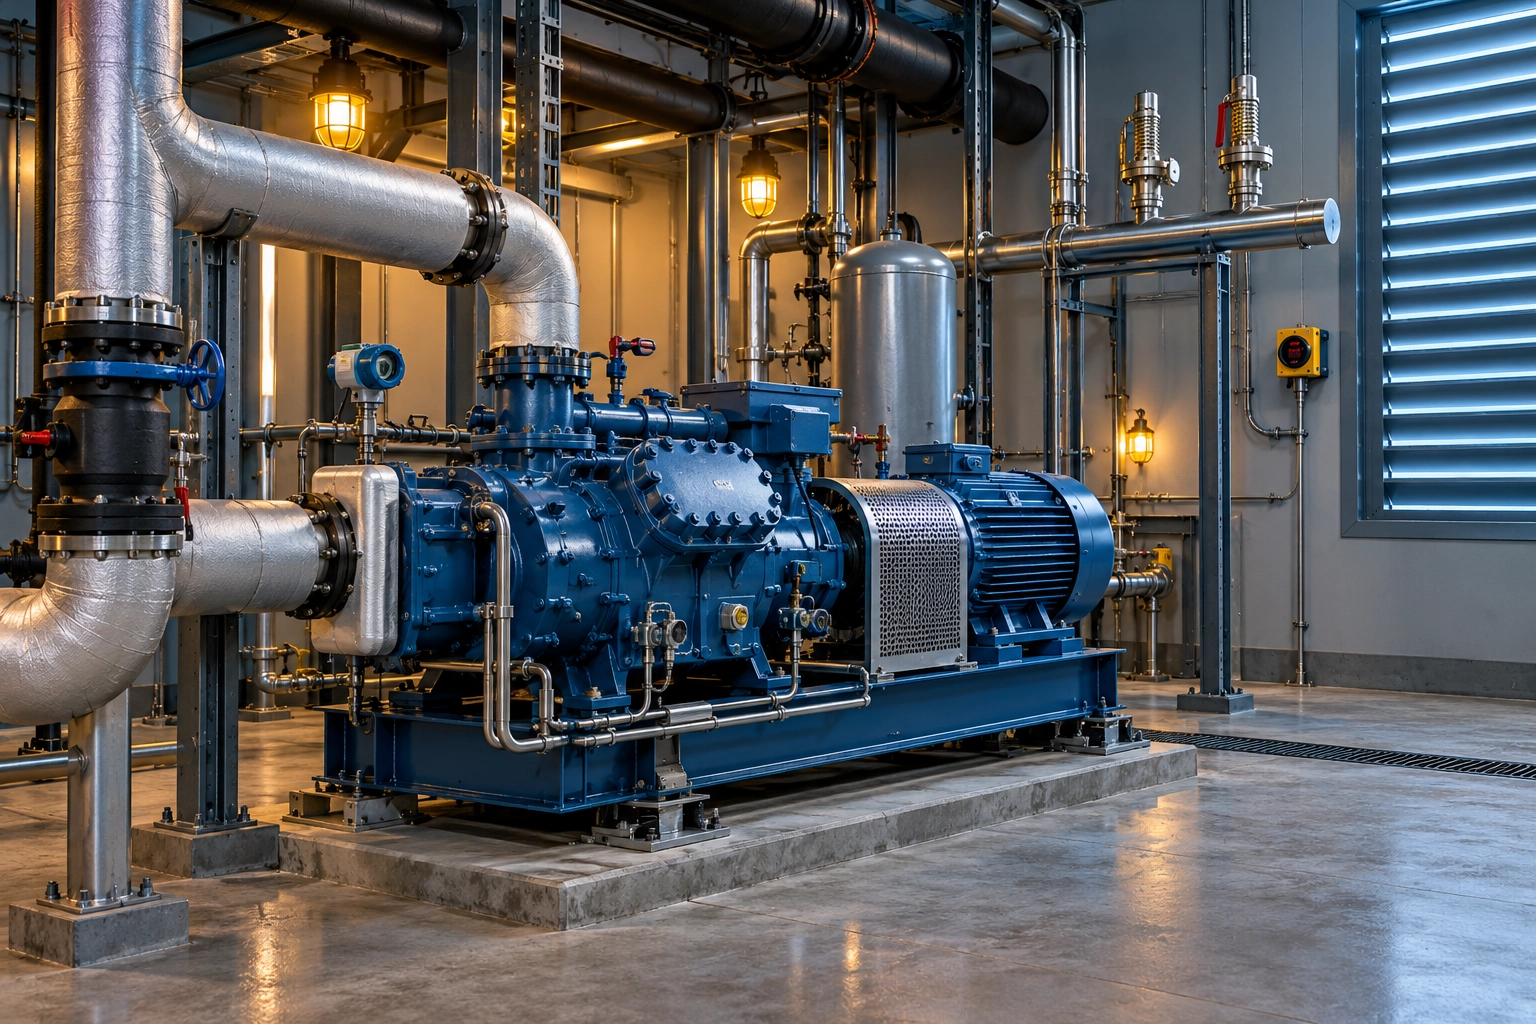 AC-071AC-072AC-073AC-074AC-075AC-076AC-077AC-078AC-079AC-080AC-081AC-082AC-084AC-085AC-086AC-087AC-088AC-089AC-090AC-091AC-092
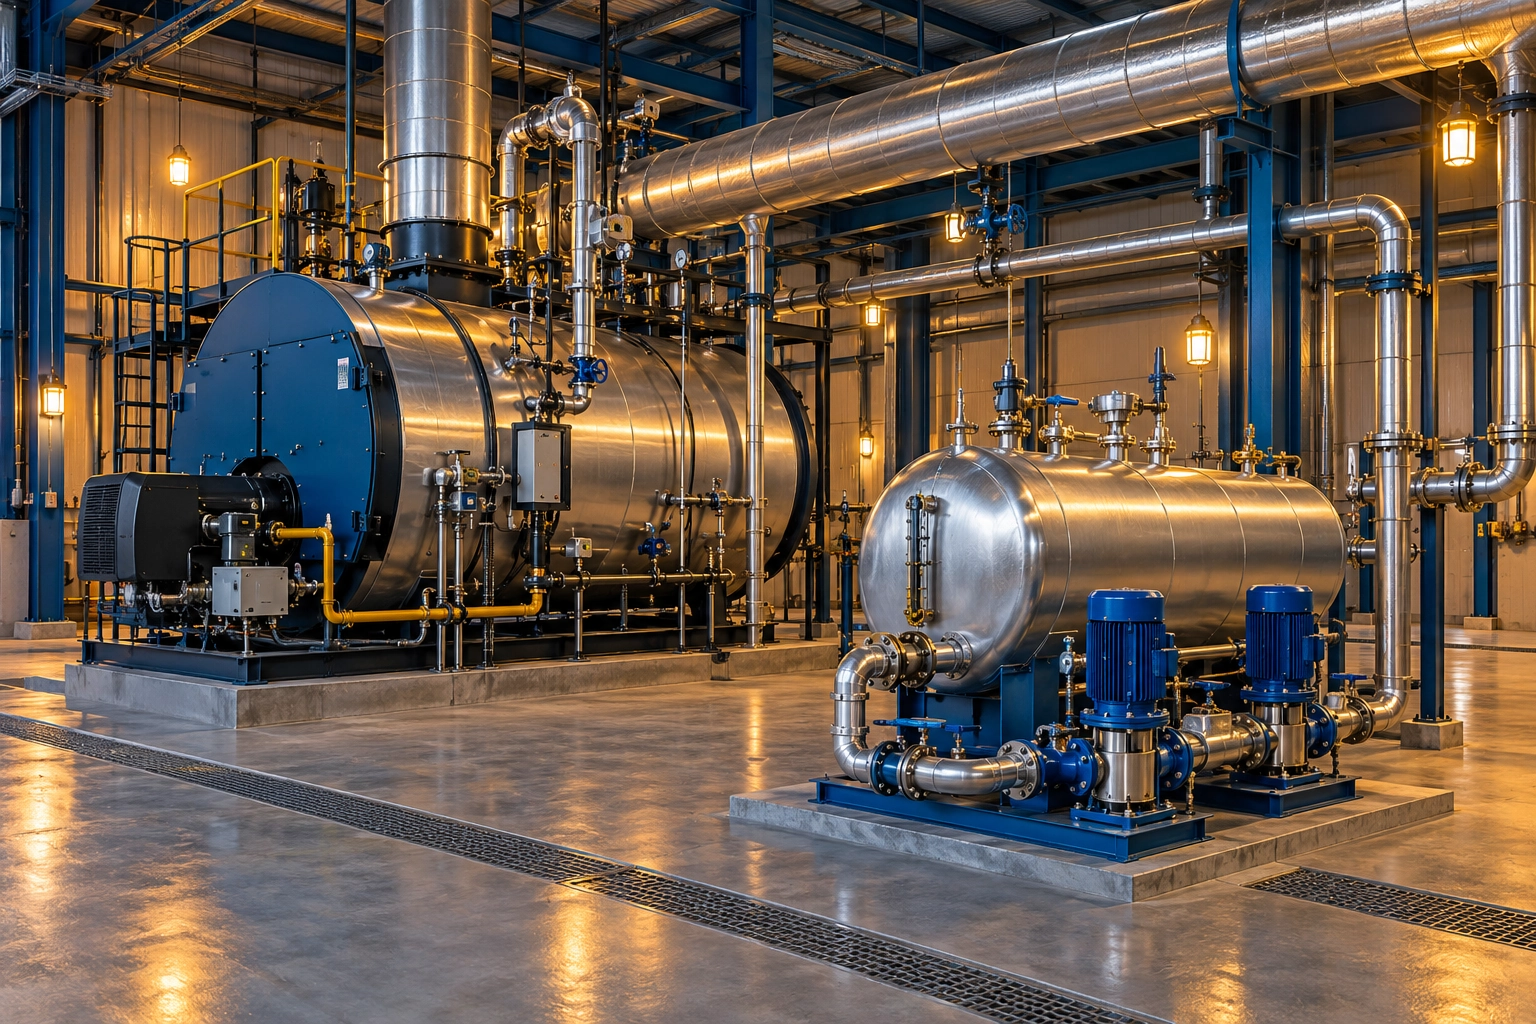 AC-093AC-094
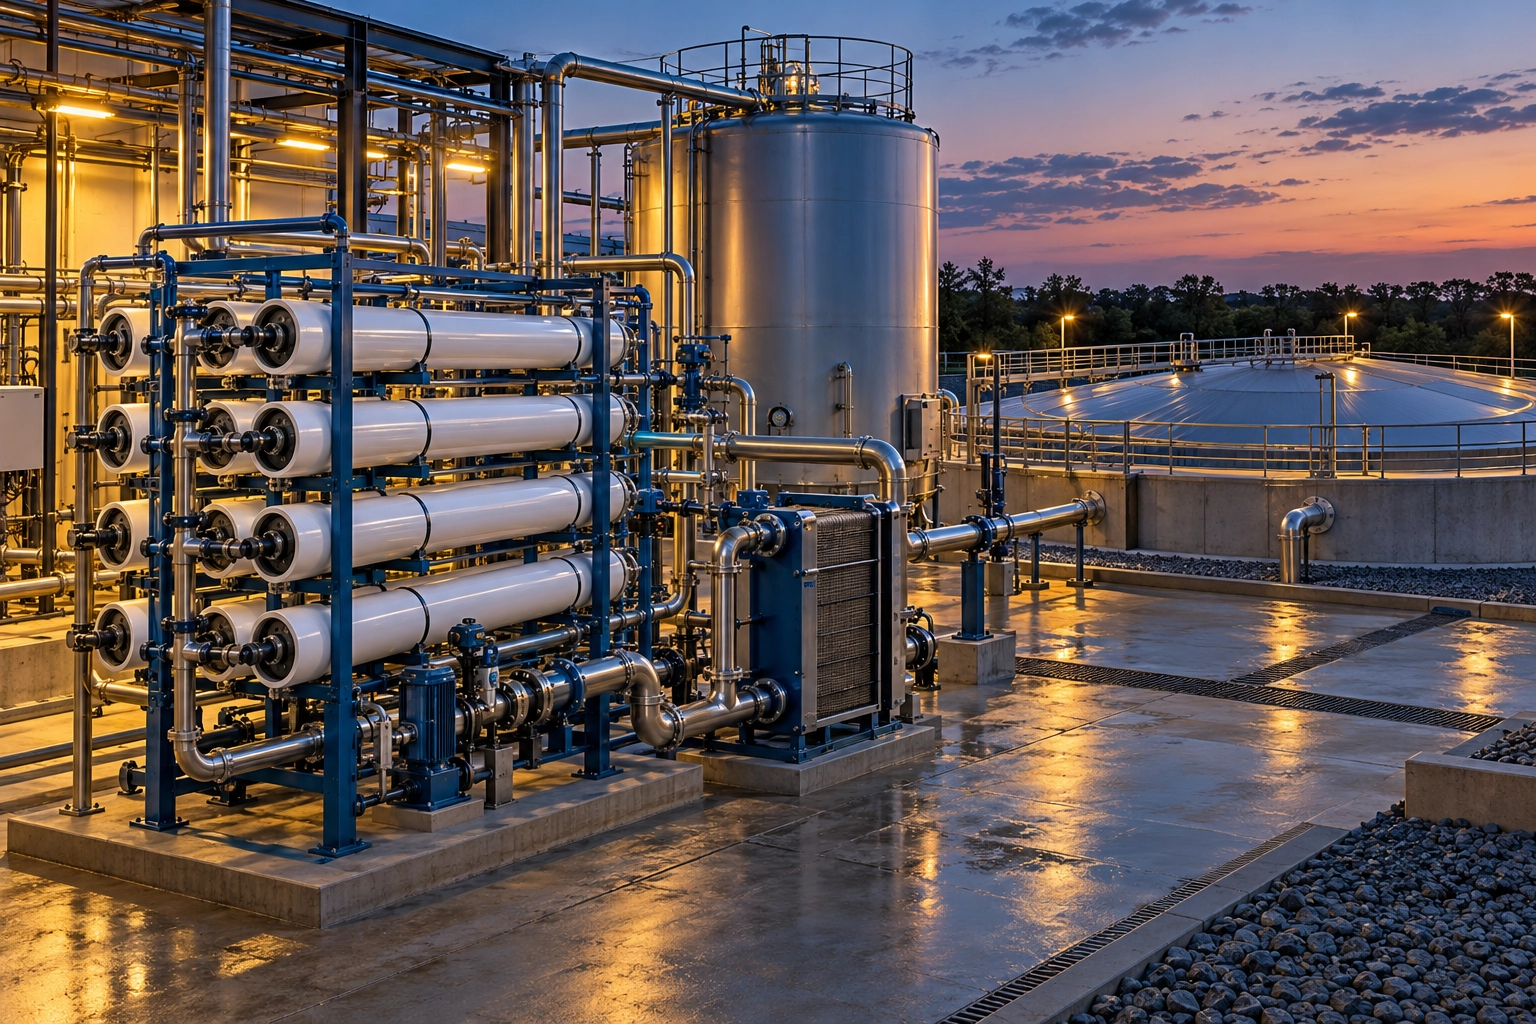 AC-095AC-096AC-097AC-098AC-099AC-100AC-101AC-102AC-103AC-104AC-105
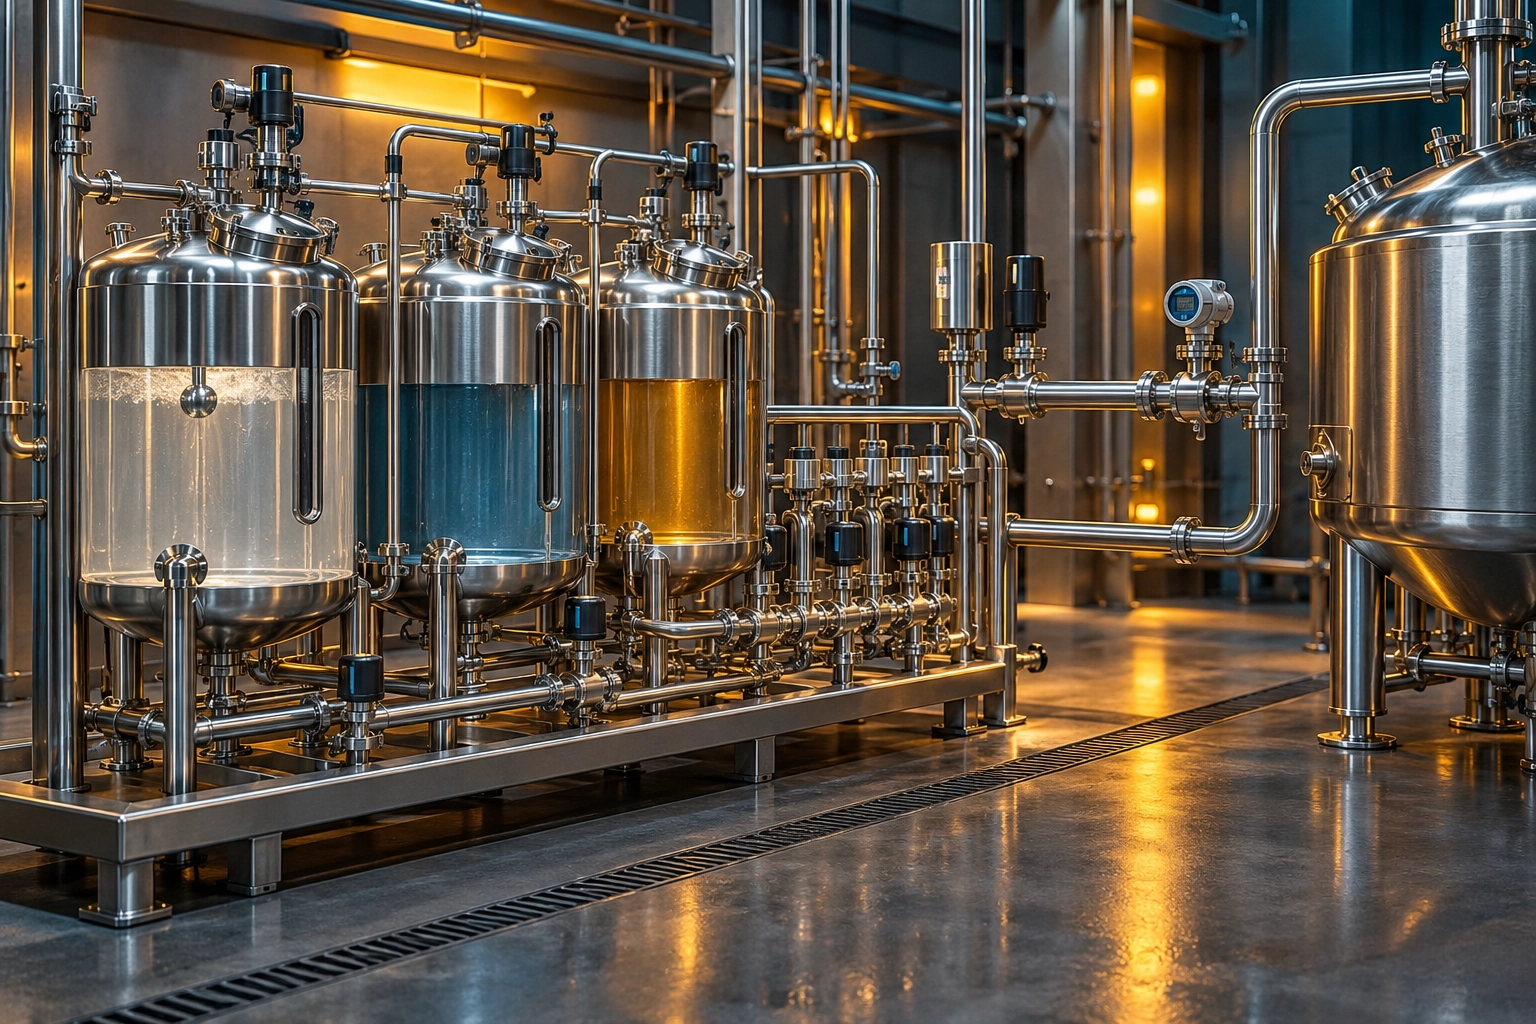 AC-106AC-107AC-108AC-109AC-110AC-111AC-112AC-113AC-114AC-115AC-116AC-117AC-118AC-119AC-120AC-121AC-122
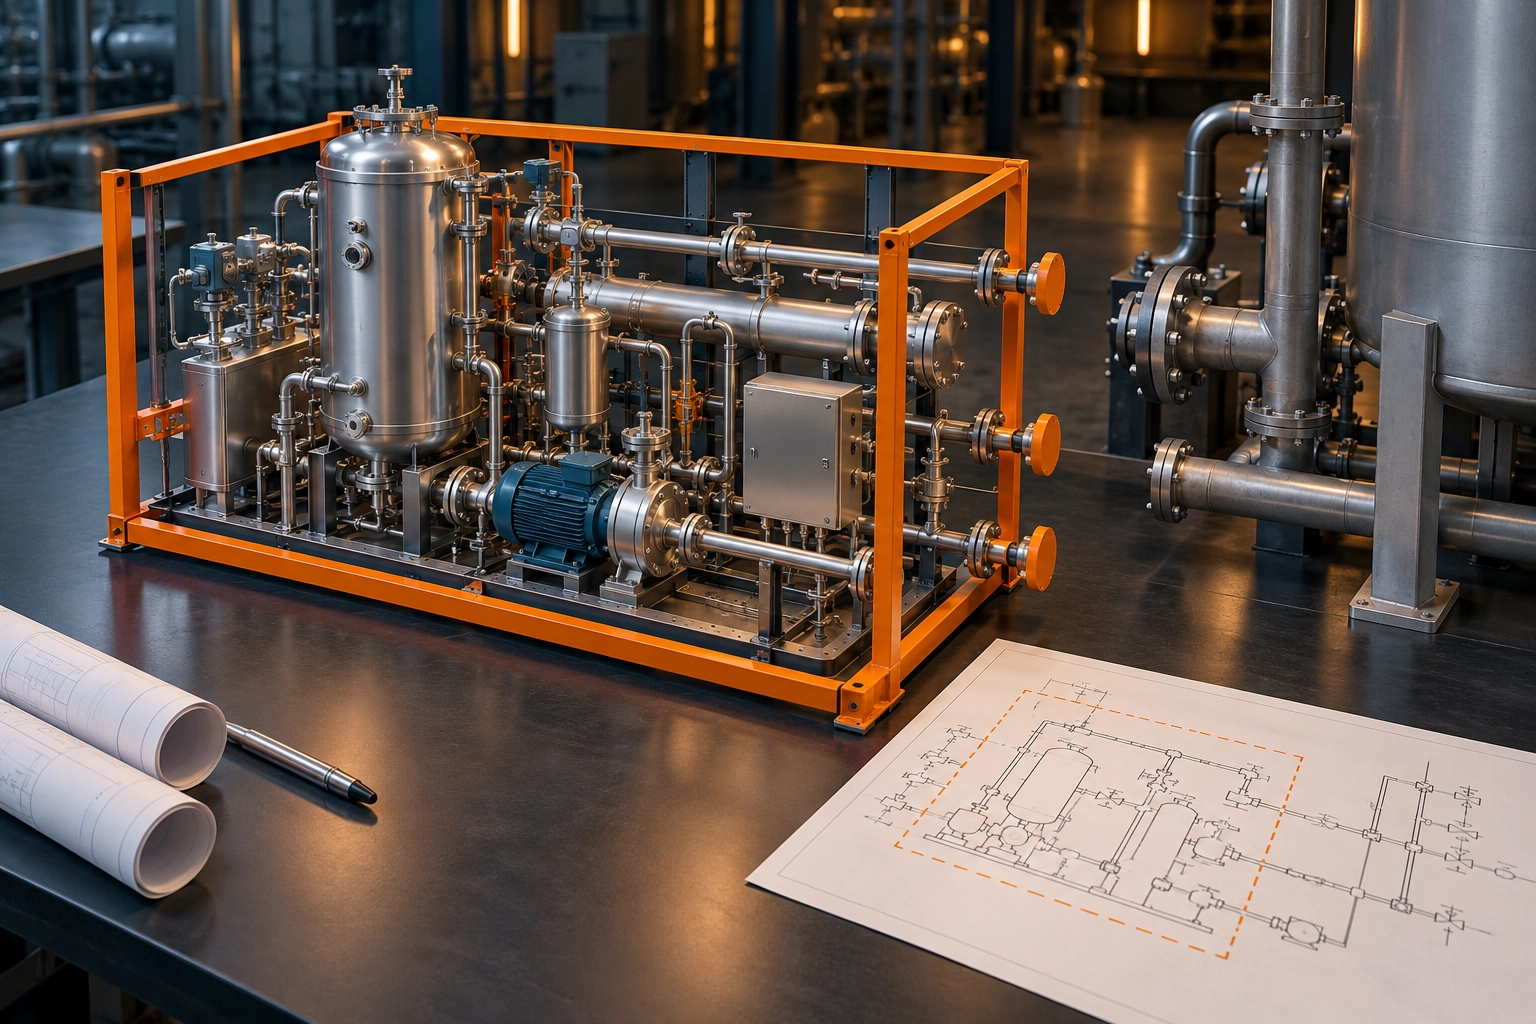 AC-123AC-124AC-125AC-126AC-127
 AC-128
 AC-129AC-130
 AC-131AC-132AC-133AC-134AC-135AC-136AC-137AC-138AC-139AC-140
Sustainable Water Treatment, Heat Recovery, and Wastewater Reuse — Complete Lifecycle Document Set ↗
AC-141AC-142AC-143AC-144AC-145AC-146AC-147AC-148AC-149AC-150AC-151AC-152AC-153AC-154AC-155AC-156AC-157AC-158AC-159AC-160AC-161AC-162AC-163AC-164AC-165AC-166AC-167AC-168AC-169AC-170AC-171AC-172AC-173AC-174AC-175AC-176AC-177AC-178AC-179AC-180AC-181AC-182AC-183AC-184AC-185AC-186AC-187AC-188AC-189AC-190AC-191AC-192AC-193AC-194AC-195AC-196AC-197AC-198AC-199AC-200AC-201AC-202AC-203AC-204AC-205AC-206AC-207AC-208AC-209AC-210AC-211AC-212AC-213AC-214AC-215AC-216AC-217AC-218AC-219AC-220AC-221AC-222AC-223AC-224AC-225AC-226AC-227AC-228AC-229AC-230AC-231AC-232AC-233 AC-234AC-235AC-236AC-237AC-238AC-239AC-240AC-241
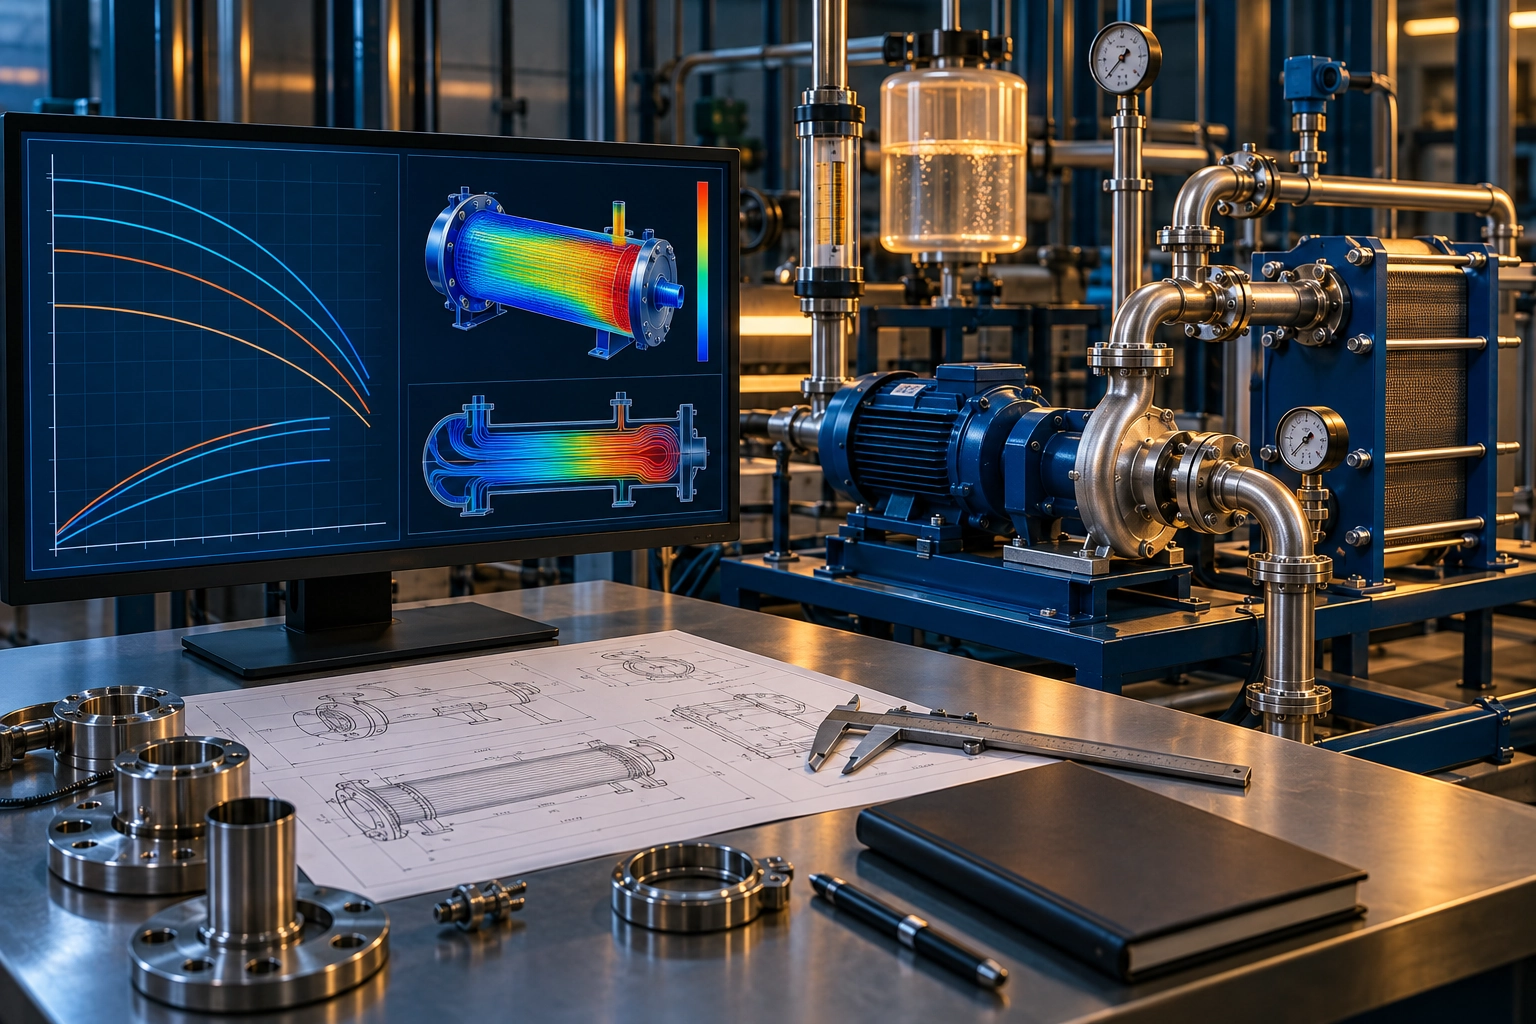 AC-242AC-243AC-244AC-245AC-246AC-247AC-248AC-249
No matching entries. Try another term.
Product and Process Families
ProductProductProductProductProductProductProductProductNo matching entries. Try another term.
Organizations
OrganizationOrganizationOrganizationOrganizationOrganizationOrganizationOrganizationNo matching entries. Try another term.
Qualifications
QualificationQualificationQualificationQualificationQualificationQualificationNo matching entries. Try another term.
Participants
ParticipantParticipantParticipantParticipantParticipantParticipantParticipantParticipantParticipantParticipantParticipantParticipantParticipantParticipantParticipantParticipantParticipantParticipantParticipantParticipantParticipantParticipantParticipantParticipantParticipantParticipantParticipantParticipantParticipantParticipantParticipantParticipantParticipantParticipantParticipantParticipantParticipantParticipantParticipantParticipantParticipantParticipantParticipantParticipantParticipantParticipantParticipantParticipantParticipantParticipantParticipantParticipantParticipantParticipantParticipantParticipantParticipantParticipantParticipantParticipantParticipantParticipantParticipantParticipantParticipantParticipantParticipantParticipantParticipantParticipantParticipantParticipantParticipantParticipantParticipantNo matching entries. Try another term.
Measures & Operating Context
Explore all 1283 metric observations by type, value, project, or task. Actual results, observations, estimates, targets, equipment ratings, and other measurement types are identified on every entry.
All 891 metric definitions (CSV) · Measurement types and counts (CSV)Observation · Observed range
Grain Conversion · 1.7 to 1.8 Grain ↗
Applies to: Investigate declining grain conversion
Observation · Manual measured
Airflow · 198 CFM ↗
Applies to: Compare HMI airflow with manual meter readings
A6 airflow and bearing-temperature investigation
Observation · Manual equivalent
Airflow · Approximately 335 m3/H ↗
Applies to: Compare HMI airflow with manual meter readings
A6 airflow and bearing-temperature investigation — Recorded approximate metric-unit equivalent of the 198 CFM manual airflow reading; retain the recorded 335 m3/h value.
Observation · HMI displayed
Airflow · 320 m3/H ↗
Applies to: Compare HMI airflow with manual meter readings
A6 airflow and bearing-temperature investigation
Observation · Reported band
HMI/Manual Deviation · -4 To 4 % ↗
Applies to: Compare HMI airflow with manual meter readings
A6 airflow and bearing-temperature investigation — Reported HMI-to-manual comparison band; retained as the source-reported band rather than a newly calculated percentage.
Target · Expected
Airflow · 280 CFM ↗
Applies to: Compare expected and measured airflow
A6 airflow and bearing-temperature investigation
Target · Expected equivalent
Airflow · Approximately 475 m3/H ↗
Applies to: Compare expected and measured airflow
A6 airflow and bearing-temperature investigation — Recorded approximate metric-unit equivalent of the 280 CFM expected airflow reference; retain the recorded 475 m3/h value.
Observation · Observed airflow deficit
Airflow Deficit · Approximately 30 % ↗
Applies to: Compare expected and measured airflow
A6 airflow and bearing-temperature investigation — Approximately 30% below expected airflow during the A6 investigation; this is a diagnosed shortfall, not an achieved improvement.
Observation · thermal imaging verified
Bearing Temperature · 150 DegF ↗
Applies to: Check bearing temperature with thermal imaging
A6 airflow and bearing-temperature investigation
Baseline · Comparison asset
Bearing Temperature · 130 DegF ↗
Applies to: Check bearing temperature with thermal imaging
A6 airflow and bearing-temperature investigation — A5 bearing temperature used as the comparison equipment reading; separate from the A6 150 degF reading.
Observation · Invalid displayed value
Erroneous Bearing Display · 617 DegF ↗
Applies to: Specify correction of the erroneous bearing display using the thermal imaging reference
A6 airflow and bearing-temperature investigation — Erroneous displayed value observed on the HMI; the independent thermal imaging bearing-temperature reference was 150 degF.
Observation · Validated reference
Bearing Temperature · 150 DegF ↗
Applies to: Specify correction of the erroneous bearing display using the thermal imaging reference
A6 airflow and bearing-temperature investigation
Operating control · Recommended setting
Bearing Alarm · 230 DegF ↗
Applies to: Specify the 230 F bearing-temperature alarm
A6 recommended bearing alarm
Operating control · Configured setting
Bearing Alarm · 230 DegF ↗
Applies to: Specify the 230 F bearing-temperature alarm
A6 recorded alarm configuration
Operating control · Operating control
Airflow Tolerance · -5 To 5 % ↗
Applies to: Specify operator airflow checks during charge and discharge
Charge/discharge
Operating control · Operator upper limit
Motor Loading · <= 80 % FLA ↗
Applies to: Define the steady-state motor-loading threshold for operator checks
Steady state
Operating control · Inspection preparation condition
Ventilation Duration · 24 H ↗
Applies to: Specify the 24-hour ventilation preparation period before internal inspection
Before internal inspection — Recorded 24-hour ventilation preparation before internal inspection; retained as protocol/readiness rather than completed tank-entry evidence.
Unresolved value · Open-question context
Startup Volume Context · 4,000 Gal ↗
Applies to: Retain startup FLA question at 4000 gallons
Startup — Unresolved question concerning startup motor loading at 4,000 gallons.
Historical/reference value · Portfolio capital value
Portfolio Capital Value · 230,000 USD ↗
Applies to: Line 1 Filler and Conveyor Upgrade
Named-project portfolio inventory — Portfolio capital value for Line 1 Filler and Conveyor Upgrade. This inventory value is separate from AFE revisions, actual costs.
Historical/reference value · Portfolio capital value
Portfolio Capital Value · 900,000 USD ↗
Applies to: Line 2 Pasteurizer Upgrades
Named-project portfolio inventory — Portfolio capital value for Line 2 Pasteurizer Upgrades. This inventory value is separate from AFE revisions, actual costs.
Historical/reference value · Portfolio capital value
Portfolio Capital Value · 150,000 USD ↗
Applies to: Line 1 Pasteurizer Repair
Named-project portfolio inventory — Portfolio capital value for Line 1 Pasteurizer Repair. This inventory value is separate from AFE revisions, actual costs.
Historical/reference value · Portfolio capital value
Portfolio Capital Value · 314,000 USD ↗
Applies to: Line 1 Mixer Bottle Conversion to 28 mm PCO
Named-project portfolio inventory — Portfolio capital value for Line 1 Mixer Bottle Conversion to 28 mm PCO. This inventory value is separate from AFE revisions, actual costs.
Historical/reference value · Portfolio capital value
Portfolio Capital Value · 5,300,000 USD ↗
Applies to: Lines 1 & 2 Bottling and Packaging Lines
Named-project portfolio inventory — Portfolio capital value for Lines 1 & 2 Bottling and Packaging Lines. This inventory value is separate from AFE revisions, actual costs.
Historical/reference value · Portfolio capital value
Portfolio Capital Value · 5,310,000 USD ↗
Applies to: Acetator Project A9 and A10
Named-project portfolio inventory — Portfolio capital value for Acetator Project A9 and A10. This inventory value is separate from AFE revisions, actual costs.
Historical/reference value · Portfolio capital value
Portfolio Capital Value · 6,100,000 USD ↗
Applies to: Acetator Expansion Project + VOC Scrubber Systems
Named-project portfolio inventory — Portfolio capital value for Acetator Expansion Project + VOC Scrubber Systems. This inventory value is separate from AFE revisions, actual costs.
Historical/reference value · Portfolio capital value
Portfolio Capital Value · 2,359,000 USD ↗
Applies to: Acetator #6 and ACV Filtering Expansion
Named-project portfolio inventory — Portfolio capital value for Acetator #6 and ACV Filtering Expansion. This inventory value is separate from AFE revisions, actual costs.
Historical/reference value · Portfolio capital value
Portfolio Capital Value · 4,288,000 USD ↗
Applies to: Acetator Expansion
Named-project portfolio inventory — Portfolio capital value for Acetator Expansion. This inventory value is separate from AFE revisions, actual costs.
Historical/reference value · Portfolio capital value
Portfolio Capital Value · 1,100,000 USD ↗
Applies to: Ceramic Crossflow Filter System + Ion Exchange Trial
Named-project portfolio inventory — Portfolio capital value for Ceramic Crossflow Filter System + Ion Exchange Trial. This inventory value is separate from AFE revisions, actual costs.
Historical/reference value · Portfolio capital value
Portfolio Capital Value · 400,000 USD ↗
Applies to: Winery Centrifuge and CIP Interface Engineering + Vinegar Transfer Centrifuge Loop
Named-project portfolio inventory — Portfolio capital value for Winery Centrifuge and CIP Interface Engineering + Vinegar Transfer Centrifuge Loop. This inventory value is separate from AFE revisions, actual costs.
Historical/reference value · Portfolio capital value
Portfolio Capital Value · 334,000 USD ↗
Applies to: Centrifuge Installation and Interface Engineering
Named-project portfolio inventory — Portfolio capital value for Centrifuge Installation and Interface Engineering. This inventory value is separate from AFE revisions, actual costs.
Historical/reference value · Portfolio capital value
Portfolio Capital Value · 347,000 USD ↗
Applies to: Centrifuge filtration recovery and equipment-relocation evaluation
Named-project portfolio inventory — Portfolio capital value for Centrifuge Filtration System. This inventory value is separate from AFE revisions, actual costs.
Historical/reference value · Portfolio capital value
Portfolio Capital Value · 347,000 USD ↗
Applies to: Wine pre-filtration trial and downstream throughput evaluation
Named-project portfolio inventory — Portfolio capital value for Centrifuge Filtration System. This inventory value is separate from AFE revisions, actual costs.
Historical/reference value · Portfolio capital value
Portfolio Capital Value · 370,000 USD ↗
Applies to: Winery Centrifuge Filtration
Named-project portfolio inventory — Portfolio capital value for Winery Centrifuge Filtration. This inventory value is separate from AFE revisions, actual costs.
Historical/reference value · Portfolio capital value
Portfolio Capital Value · 235,000 USD ↗
Applies to: Centrifuge Filtration
Named-project portfolio inventory — Portfolio capital value for Centrifuge Filtration. This inventory value is separate from AFE revisions, actual costs.
Historical/reference value · Portfolio capital value
Portfolio Capital Value · 500,000 USD ↗
Applies to: Electrical Infrastructure Modernization
Named-project portfolio inventory — Portfolio capital value for Electrical Infrastructure Modernization. This inventory value is separate from AFE revisions, actual costs.
Historical/reference value · Portfolio capital value
Portfolio Capital Value · 1,450,000 USD ↗
Applies to: Boiler System + Plant Steam & Condensate Optimization
Named-project portfolio inventory — Portfolio capital value for Boiler System + Plant Steam & Condensate Optimization. This inventory value is separate from AFE revisions, actual costs.
Historical/reference value · Portfolio capital value
Portfolio Capital Value · 52,000 USD ↗
Applies to: Warehouse heat-reduction ventilation project overview
Named-project portfolio inventory — Portfolio capital value for Shipping Warehouse Temperature Reduction and Boiler Room Exhaust Ventilation. This inventory value is separate from AFE revisions, actual costs.
Historical/reference value · Portfolio capital value
Portfolio Capital Value · 250,000 USD ↗
Applies to: Steam-system repair and temperature-control retrofit
Named-project portfolio inventory — Portfolio capital value for Reduction System Steam Repair and Temperature Control Retrofit. This inventory value is separate from AFE revisions, actual costs.
Historical/reference value · Portfolio capital value
Portfolio Capital Value · 1,300,000 USD ↗
Applies to: Production-cooling upgrade with three 160-ton chillers
Named-project portfolio inventory — Portfolio capital value for production-cooling upgrade with three 160-ton chillers. This inventory value is separate from AFE revisions, actual costs.
Historical/reference value · Portfolio capital value
Portfolio Capital Value · 150,000 USD ↗
Applies to: Fermenter & Acetator Cooling Alarm System
Named-project portfolio inventory — Portfolio capital value for Fermenter & Acetator Cooling Alarm System. This inventory value is separate from AFE revisions, actual costs.
Historical/reference value · Portfolio capital value
Portfolio Capital Value · 1,200,000 USD ↗
Applies to: Cooling Tower, Chiller Circuit, and Injection Well Retrofit
Named-project portfolio inventory — Portfolio capital value for Cooling Tower, Chiller Circuit, and Injection Well Retrofit. This inventory value is separate from AFE revisions, actual costs.
Historical/reference value · Portfolio capital value
Portfolio Capital Value · 531,000 USD ↗
Applies to: 250 Ton Chiller Standby Capacity
Named-project portfolio inventory — Portfolio capital value for 250 Ton Chiller Standby Capacity. This inventory value is separate from AFE revisions, actual costs.
Historical/reference value · Portfolio capital value
Portfolio Capital Value · 100,000 USD ↗
Applies to: Acetator A5 Upgrade and Cooling Coordination
Named-project portfolio inventory — Portfolio capital value for Acetator A5 Upgrade and Cooling Coordination. This inventory value is separate from AFE revisions, actual costs.
Historical/reference value · Portfolio capital value
Portfolio Capital Value · 900,000 USD ↗
Applies to: Line 1 Capper and Conveyor Upgrade + Bulk Nitrogen Transition
Named-project portfolio inventory — Portfolio capital value for Line 1 Capper and Conveyor Upgrade + Bulk Nitrogen Transition. This inventory value is separate from AFE revisions, actual costs.
Historical/reference value · Portfolio capital value
Portfolio Capital Value · 225,000 USD ↗
Applies to: Nitrogen Dosing, Automated Microbulk Refill Station + Storage Tank Conversion
Named-project portfolio inventory — Portfolio capital value for Nitrogen Dosing, Automated Microbulk Refill Station+ Storage Tank Conversion. This inventory value is separate from AFE revisions, actual costs.
Historical/reference value · Portfolio capital value
Portfolio Capital Value · 250,000 USD ↗
Applies to: Fiberoptic OT Network
Named-project portfolio inventory — Portfolio capital value for Fiberoptic OT Network. This inventory value is separate from AFE revisions, actual costs.
Historical/reference value · Portfolio capital value
Portfolio Capital Value · 153,000 USD ↗
Applies to: Tank Measurement Project standardization
Named-project portfolio inventory — Portfolio capital value for Tank Measurement Project standardization. This inventory value is separate from AFE revisions, actual costs.
Historical/reference value · Portfolio capital value
Portfolio Capital Value · 148,000 USD ↗
Applies to: Tank-level measurement standards and procurement alignment
Named-project portfolio inventory — Portfolio capital value for Tank Level Measurement System Standardization. This inventory value is separate from AFE revisions, actual costs.
Historical/reference value · Portfolio capital value
Portfolio Capital Value · 161,000 USD ↗
Applies to: Tank-measurement standards for future upgrades
Named-project portfolio inventory — Portfolio capital value for Tank Measurement System Standardization. This inventory value is separate from AFE revisions, actual costs.
Historical/reference value · Portfolio capital value
Portfolio Capital Value · 167,000 USD ↗
Applies to: Tank-level monitoring and field-access planning
Named-project portfolio inventory — Portfolio capital value for Tank Level Monitoring Standardization. This inventory value is separate from AFE revisions, actual costs.
Historical/reference value · Portfolio capital value
Portfolio Capital Value · 500,000 USD ↗
Applies to: Drainage and erosion-control project overview
Named-project portfolio inventory — Portfolio capital value for Site Enhancements, Drainage Erosion Mitigation, and Runoff Controls. This inventory value is separate from AFE revisions, actual costs.
Historical/reference value · Portfolio capital value
Portfolio Capital Value · 150,000 USD ↗
Applies to: Filtering-room acetator electrical control room
Named-project portfolio inventory — Portfolio capital value for Filtering Room Acetator Electrical Control Room (SHI-25). This inventory value is separate from AFE revisions, actual costs.
Budget or authorization · Project budget
Portfolio Capital Value · 12,800,000 USD ↗
Applies to: Fermentation Extract Manufacturing Commercialization
Portfolio project register — Budget for the full recorded project; actual cost and estimate at completion are separate observations.
Budget or authorization · Project budget
Portfolio Capital Value · 4,200,000 USD ↗
Applies to: Processed Meat and Seafood Soluble RBE Application Platform
Portfolio project register — Budget for the full recorded project; actual cost and estimate at completion are separate observations.
Budget or authorization · Project budget
Portfolio Capital Value · 3,100,000 USD ↗
Applies to: Rice Bran Extract Meat-Analogue Platform Extension
Portfolio project register — Budget for the full recorded project; actual cost and estimate at completion are separate observations.
Budget or authorization · Project budget
Portfolio Capital Value · 18,400,000 USD ↗
Applies to: Continuous Fermentation Natural Curing-Agent Process
Portfolio project register — Budget for the full recorded project; actual cost and estimate at completion are separate observations.
Budget or authorization · Project budget
Portfolio Capital Value · 2,600,000 USD ↗
Applies to: Manufacturing Scheduling and MOM/MES Evaluation
Portfolio project register — Budget for the full recorded project; actual cost and estimate at completion are separate observations.
Budget or authorization · Project budget
Portfolio Capital Value · 6,900,000 USD ↗
Applies to: Sustainable Water Treatment, Heat Recovery, and Wastewater Reuse
Portfolio project register — Budget for the full recorded project; actual cost and estimate at completion are separate observations.
Budget or authorization · Project budget
Portfolio Capital Value · 9,700,000 USD ↗
Applies to: 480 V Electrical Service and Power-Quality Modernization
Portfolio project register — Budget for the full recorded project; actual cost and estimate at completion are separate observations.
Budget or authorization · Project budget
Portfolio Capital Value · 900,000 USD ↗
Applies to: Ammonia/Glycol Refrigeration Safety, Compliance, and Mechanical-Integrity Retrofit
Portfolio project register — Budget for the full recorded project; actual cost and estimate at completion are separate observations.
Estimate · Estimated benefit
Estimated Annual Transportation Benefit · 1,300,000 USD/Year ↗
Applies to: Acetator #6 and ACV Filtering Expansion
Target · Planned production capacity increase
Local Production Context · 500,000 Gallon/Year ↗
Applies to: Acetator #6 and ACV Filtering Expansion
A6 local-production expansion business case — 0.5 million gallons/year local-production capacity objective underlying the estimated transportation benefit; separate from the parent 5.8 million-grain-gallon throughput record.
Target · VOC capture/recovery objective
Operating Measure · <= 75 % ↗
Applies to: A5/A6 acetator expansion and VOC-recovery integration
VOC-scrubber engineering — Design capture/recovery objective for process VOCs within the acetator-expansion scrubber-system boundary.
Actual result · Recorded loadout performance
Volume · 500 GPM ↗
Applies to: Tanker Loadout and Transfer Optimization
tanker loadout — Recorded 500 GPM tanker loadout performance in the case.
Actual result · Recorded filling accuracy
Operating Measure · 99.9 % ↗
Applies to: Tanker Loadout and Transfer Optimization
tanker loadout — Recorded 99.9% filling accuracy in the case.
Actual result · Operating benefit
Operating Benefit · 229,000 USD/Year ↗
Applies to: ceramic membrane ceramic-crossflow system integration
Recorded ceramic-filtration OPEX reduction of approximately $229,000 per year. The related labor-cost measure and financial-option comparisons are separate analytical views of this project.
Design parameter · Peak-demand design basis
Volume · 31,520 GPD ↗
Applies to: ceramic membrane ceramic-crossflow system integration
Ceramic filtration demand support — 31,520 GPD peak-demand support basis for the ceramic filtration system.
Baseline · Vendor laboratory baseline
Operating Measure · Approximately 90 % ↗
Applies to: Reviewed the vendor filterability study as a design baseline for ceramic filtration: membrane flux, pore size, clean-water-flux recovery after CIP and filtrate turbidity
study, 2018 — after one CIP — Clean-water-flux recovery in the filtration supplier vendor study.
Baseline · Vendor laboratory baseline
Turbidity · 0.26 to 0.39 NTU ↗
Applies to: Reviewed the vendor filterability study as a design baseline for ceramic filtration: membrane flux, pore size, clean-water-flux recovery after CIP and filtrate turbidity
study, 2018 — filtrate — Filtrate turbidity in the filtration supplier vendor study.
Design parameter · Peak-demand design basis
Volume · 31,520 GPD ↗
Applies to: Filtration Demand and Capacity Modeling
Filtration demand and capacity modeling — 31,520 GPD peak demand used in the filtration sizing model.
Design parameter · Design demand
WDV Peak Demand · > 22,000 GPD ↗
Applies to: Filtration Demand and Capacity Modeling
WDV above 22,000 GPD
Observation · Recorded operator interaction
Time · < 5 Minutes ↗
Applies to: Ceramic Filter CIP Interface Engineering
Ceramic filtration automated operation — Recorded operator interaction of less than 5 minutes for the automated filtration/CIP arrangement.
Actual result · Recorded operating improvement
Operating Measure · > 50 % ↗
Applies to: Ceramic Filter CIP Interface Engineering
ceramic-filter operation — Recorded increase of more than 50% in run time between cleaning cycles; separate from the laboratory flux-recovery measurement.
Estimate · Option cost difference
Annual OPEX Premium of Legacy Alternative · Approximately 150,000 USD/Year ↗
Applies to: Ceramic Filtration Cost-per-Gallon and NPV Model
Option comparison — $472K Filtration supplier + Filtration supplier alternative plus approximately $150K annual OPEX premium.
Estimate · Corrected operating-cost difference
Annual OPEX Difference · 150,000 USD/Year ↗
Applies to: Ceramic Crossflow Option Comparison and AFE Clarification
$150,000 annual operating-cost difference, corrected from a capital-cost interpretation.
Estimate · Estimated waste reduction
Operating Measure · 5,850 lb/Year ↗
Applies to: Ceramic Filtration Sustainability and Operator Exposure Reduction
Ceramic-filtration benefit estimate — Estimated 5,850 lb/year reduction in disposable filtration waste; an annualized estimate, not a weighed annual total.
Actual result · Cost reduction
Annual Filtration Labor-Cost Reduction · 65,286 USD/Year ↗
Applies to: Ceramic Filtration Labor-Cost Reduction
Before/after comparison — Recorded annual filtration labor-cost reduction: $67,392 before automation less $2,106 after automation equals $65,286 per year. This is a related filtration benefit measure, not an additional amount to add automatically to the broader OPEX reduction.
Estimate · Deferred capital estimate
Future Filtration Capital Deferred · 500,000 USD ↗
Applies to: Ceramic Filtration Modular Expansion Strategy
Expansion option — $500K future capital expense deferred.
Design parameter · Modular design expansion
Operating Measure · 50 % ↗
Applies to: Ceramic Filtration Modular Expansion Strategy
Future 2-by-2 to 2-by-3 membrane expansion — 50% plug-in expansion path in the modular filtration design; future capacity option.
Estimate · Estimated annual benefit
Annual Transportation-Cost Reduction · 1,300,000 USD/Year ↗
Applies to: Acetator #6 and Wine Vinegar Filtering Expansion
Estimated annual interplant transportation-cost reduction associated with local production expansion.
Design parameter · Electrical design specification
Electrical Power · 4 kW ↗
Applies to: Ceramic Filter Electrical and Controls Coordination
Ceramic-filter manifold electrical construction firm — Specified 4 kW manifold feed in the 480 V electrical design; not measured energy consumption.
Observation · Recorded operator interaction
Time · < 5 Minutes ↗
Applies to: Ceramic Filter Electrical and Controls Coordination
Ceramic filtration automated operation — Recorded operator interaction of less than 5 minutes per shift in the automation context.
Observation · Trial observation
Solids Removal · 95 % ↗
Applies to: Centrifuge Trial Performance, Documentation, and Supplier Tradeoff Analysis
Centrifuge supplier comparative trial — 95% solids removal at 40 GPM
Observation · Trial observation
Trial Throughput · 40 GPM ↗
Applies to: Centrifuge Trial Performance, Documentation, and Supplier Tradeoff Analysis
Centrifuge supplier comparative trial — 95% solids removal at 40 GPM
Observation · Trial observation
Solids Removal · 83 % ↗
Applies to: Centrifuge Trial Performance, Documentation, and Supplier Tradeoff Analysis
Centrifuge supplier comparative trial — 83% at 50 GPM
Observation · Trial observation
Trial Throughput · 50 GPM ↗
Applies to: Centrifuge Trial Performance, Documentation, and Supplier Tradeoff Analysis
Centrifuge supplier comparative trial — 83% at 50 GPM
Baseline · Earlier trial observation
Centrifuge Supplier Earlier Trial Limitation · 20 GPM ↗
Applies to: Centrifuge Trial Performance, Documentation, and Supplier Tradeoff Analysis
Earlier supplier comparison — Earlier recorded 20 GPM limitation; later Brew 250 operation reached 40 GPM near baseline after nozzle correction.
Design parameter · Design runoff basis
Roof-Runoff Design Flow · 545 GPM ↗
Applies to: Erosion Remediation and Rainwater Management
6 inch/hour rainfall design — 545 GPM
Observation · Surveyed condition
Slab Void Length · 85 ft ↗
Applies to: Erosion Remediation and Rainwater Management
85 ft x 4 ft x 2 ft void
Observation · Surveyed condition
Slab Void Width · 4 ft ↗
Applies to: Erosion Remediation and Rainwater Management
85 ft x 4 ft x 2 ft void
Observation · Surveyed condition
Slab Void Depth · 2 ft ↗
Applies to: Erosion Remediation and Rainwater Management
85 ft x 4 ft x 2 ft void
Design parameter · Design dimension
Outlet Basin Length · 10 ft ↗
Applies to: Erosion Remediation and Rainwater Management
10 ft x 15 ft x 2 ft basin.
Design parameter · Design dimension
Outlet Basin Width · 15 ft ↗
Applies to: Erosion Remediation and Rainwater Management
10 ft x 15 ft x 2 ft basin.
Design parameter · Design velocity limit
Outlet Velocity Target · < 6 ft/S ↗
Applies to: Civil and Hydraulic Design Detail
<6 ft/s outlet target.
Observation · Audit finding
Critically Loose Sanitary-Clamp Share · 25 Percent ↗
Applies to: Ceramic-filter SOP, preventive-maintenance and CIP audit
25 percent critically loose
Observation · Audit finding
Gearbox Oil Depletion · 90 Percent ↗
Applies to: Ceramic-filter SOP, preventive-maintenance and CIP audit
gearbox 90 percent empty
Target · Trial operating target
Centrifuge Throughput Target · 40 GPM ↗
Applies to: Winery Centrifuge Trial Prep and Utility Coordination
40 GPM operating target
Target · Trial target
Outlet Clarity Target · 20 to 30 NTU ↗
Applies to: Winery Centrifuge Trial Prep and Utility Coordination
20–30 NTU outlet target
Observation · Trial observation
Brew 250 Outlet Turbidity · 36 to 40 NTU ↗
Applies to: Winery Centrifuge Trial Prep and Utility Coordination
After temporary deaeration-nozzle correction — approximately 36–40 NTU observed after nozzle correction
Design parameter · Planned trial input
Planned CIP Caustic Concentration · 1 % ↗
Applies to: Rice Wine Decanter Trial
Temporary trial cleaning — 1% caustic at 140°F
Design parameter · Planned trial input
Planned CIP Temperature · 140 DegF ↗
Applies to: Rice Wine Decanter Trial
Temporary trial cleaning — 1% caustic at 140°F
Estimate · Estimated option benefit
Estimated Decanter Capital-Cost Advantage · 50 To 75 % ↗
Applies to: Rice Wine Decanter Trial
Decanter versus separator comparison — estimated 50%–75% capital-cost advantage
Estimate · Projected first-year benefit
First-Year Labor Optimization · Approximately 135,000 USD ↗
Applies to: Lines 1 & 2 Bottling Expansion
Expansion planning — approximately $135K first-year labor optimization.
Design parameter · Design capacity
128 Oz Line Design Speed · 121 BPM ↗
Applies to: Lines 1 & 2 Bottling Expansion
Bottling expansion design — 121 BPM for 128 oz
Design parameter · Design capacity
64 Oz Line Design Speed · 200 BPM ↗
Applies to: Lines 1 & 2 Bottling Expansion
Bottling expansion design — 200 BPM for 64 oz
Estimate · Projected changeover reduction
Annual Changeover Reduction · 183 Hours/Year ↗
Applies to: Lines 1 & 2 Bottling Expansion
Bottling expansion design — 183 hours/year changeover reduction
Estimate · Projected operating improvement
OEE Capacity Reclaimed · 5.5 % ↗
Applies to: Lines 1 & 2 Bottling Expansion
Bottling expansion design — 5.5% OEE reclaimed
Scope or inventory quantity · Design quantity
Slot-Drain Length · 120 ft ↗
Applies to: Lines 1 & 2 Facility and Sanitary Infrastructure
120 ft of 4-inch slot drain
Equipment rating · Equipment capability
Filler Feed Capability · >= 85 GPM ↗
Applies to: Line 1 Filler Valve and Product Return Upgrade
>=85 GPM feed capability
Observation · Recorded SKU filling rate
64 Oz Filling Throughput · 120 BPM ↗
Applies to: Line 1 Filler Valve and Product Return Upgrade
Portfolio-reported SKU filling rate in the Line 1 filler case; no before/after rate comparison is supplied for this observation.
Observation · Recorded SKU filling rate
128 Oz Filling Throughput · 60 BPM ↗
Applies to: Line 1 Filler Valve and Product Return Upgrade
Portfolio-reported SKU filling rate in the Line 1 filler case; no before/after rate comparison is supplied for this observation.
Observation · Recorded SKU filling rate
750 ML Filling Throughput · 125 BPM ↗
Applies to: Line 1 Filler Valve and Product Return Upgrade
Portfolio-reported SKU filling rate in the Line 1 filler case; no before/after rate comparison is supplied for this observation.
Baseline · Existing configuration
Existing Hold-Tube Length · 80 ft ↗
Applies to: Line 2 Pasteurizer and Hot Water Set Rebuild
80 ft existing hold tube
Design parameter · Design demand
Pasteurizer Design Flow · 115 GPM ↗
Applies to: Line 2 Pasteurizer and Hot Water Set Rebuild
115 GPM design rate
Design parameter · Calculated design requirement
Required Hold-Tube Length · 171 ft ↗
Applies to: Line 2 Pasteurizer and Hot Water Set Rebuild
115 GPM design — 171 ft required length
Scenario or model result · Calculated capacity limit
Existing Hold-Tube Sufficiency Flow · 54 GPM ↗
Applies to: Line 2 Pasteurizer and Hot Water Set Rebuild
Existing 80 ft hold tube — 54 GPM sufficiency basis
Estimate · Estimated benefit
Estimated Benefit · 90,000 USD/Year ↗
Applies to: Line 1 Capper, Conveyor, Cap Elevator, cryogenic dosing, and Bulk Nitrogen Modernization
$90K/year modeled nitrogen savings
Equipment rating · Equipment rating
Capper Rated Capacity · 150 BPM ↗
Applies to: Line 1 Capper, Conveyor, Cap Elevator, cryogenic dosing, and Bulk Nitrogen Modernization
150 BPM capper rating
Equipment rating · Storage capacity
Bulk Nitrogen Tank Volume · 5,500 Gal ↗
Applies to: Line 1 Capper, Conveyor, Cap Elevator, cryogenic dosing, and Bulk Nitrogen Modernization
5,500 gallon bulk nitrogen tank.
Design parameter · Building design dimension
Boiler-Room Length · 22 ft ↗
Applies to: Production Boiler Electrical and Controls Coordination
22 ft x 28 ft x 20 ft boiler room
Design parameter · Building design dimension
Boiler-Room Width · 28 ft ↗
Applies to: Production Boiler Electrical and Controls Coordination
22 ft x 28 ft x 20 ft boiler room
Design parameter · Building design dimension
Boiler-Room Height · 20 ft ↗
Applies to: Production Boiler Electrical and Controls Coordination
22 ft x 28 ft x 20 ft boiler room
Design parameter · Pressure-analysis basis
Initial Jacket Steam Pressure · 20 psi ↗
Applies to: Reduction Steam Delivery Manifold Redesign and PRV Optimization
Initial batch heating — 20 psi for 1-2 hours
Design parameter · Pressure-analysis basis
Initial Heating Period · 1 to 2 Hours ↗
Applies to: Reduction Steam Delivery Manifold Redesign and PRV Optimization
20 psi initial heating — 20 psi for 1-2 hours
Design parameter · Pressure-analysis basis
Maintenance Jacket Steam Pressure · 8 to 10 psi ↗
Applies to: Reduction Steam Delivery Manifold Redesign and PRV Optimization
Remainder of two-day batch — 8-10 psi for remainder of two-day batch
Equipment rating · Equipment reference
Condensate-Pump Power Range · 1 to 2 HP ↗
Applies to: Reduction Steam Delivery Manifold Redesign and PRV Optimization
1-2 HP condensate pumps.
Design parameter · Design fan capacity
Specified Exhaust Airflow · 5,000 CFM ↗
Applies to: Boiler-room exhaust design and ductwork scope
AFE-ready ventilation scope — 5000 CFM exhaust fan
Estimate · Projected rental avoidance
Rental Boiler Cost Avoidance · 15,000 USD/Month ↗
Applies to: Boiler System Overhaul and Steam / Condensate Optimization
Boiler replacement business case — projected $15K/month rental avoidance
Historical/reference value · Reported annual energy benefit
Annual Energy Savings · > 11,000 USD/Year ↗
Applies to: Boiler System Overhaul and Steam / Condensate Optimization
Annual energy-benefit figure reported in the boiler project narrative. It is retained separately from the 1.135 MMBtu/h savings commitment, 0.5 MMBtu/h modeled benefit and projected rental avoidance.
Historical/reference value · Reported annual fuel-reduction range
Annual Fuel Reduction · 10 To 15 % ↗
Applies to: Boiler System Overhaul and Steam / Condensate Optimization
Reported 10–15% annual fuel-reduction reference in the boiler project narrative, alongside separate modeled savings and commitment values.
Baseline · Before heat recovery
Boiler Efficiency · 79.8 % ↗
Applies to: Boiler System Overhaul and Steam / Condensate Optimization
Baseline — Efficiency baseline before the recorded heat-recovery improvement.
Equipment rating · Installed nominal cooling-capacity addition
Net Added Production Cooling · 200 Refrigeration Tons ↗
Applies to: 3x 160-Ton Chiller Production Cooling Upgrade
Net added production cooling.
Actual result · Feeder-level measured reduction
Cooling Energy Reduction at Feeder Monitoring Points · 15 % ↗
Applies to: 3x 160-Ton Chiller Production Cooling Upgrade
15% cooling energy reduction at individual chiller feeder monitoring points; no plant-wide energy claim.
Equipment rating · Installed nominal cooling-capacity addition
Net Added Backup Cooling · 250 Refrigeration Tons ↗
Applies to: 250-Ton Backup Chiller and 2000A 480V Bulk Electrical Upgrade
Net added backup cooling.
Equipment rating · Electrical infrastructure rating
Bulk Service Current Rating · 2,000 A ↗
Applies to: 250-Ton Backup Chiller and 2000A 480V Bulk Electrical Upgrade
2000 amp, 480 V bulk electrical upgrade.
Equipment rating · Installed nominal cooling-capacity addition
Combined Net Added Cooling · 450 Refrigeration Tons ↗
Applies to: Total Cooling Capacity Modernization
Aggregate installed nominal cooling addition of 450 tons: 200 production plus 250 backup. The aggregate and its components are alternative reporting levels.
Equipment rating · Pump design capacity
Recirculation Pump Nominal Flow · 500 GPM ↗
Applies to: Recirculation Loop and N250 Evaporator-Loop Coordination
Two pump supplier 500 GPM pumps
Estimate · Projected annual benefit
Projected Ozone-Treatment Annual Savings · 26,500 USD/Year ↗
Applies to: Ozone cooling-water treatment retrofit
Treatment retrofit business case — Projected $26.5K/year savings
Design parameter · Design flow
Ozone-Treatment Loop Flow · 60 GPM ↗
Applies to: Ozone cooling-water treatment retrofit
60 GPM loop
Scenario or model result · Modeled exposure ratio
Downtime OPEX Exposure per Repair Dollar · Approximately 1.8 USD/USD ↗
Applies to: Cooling Financial Engineering and AFE Justification
Approximately $1.80 additional freight/labor OPEX exposure per $1 chiller repair cost.
Target · Planning target
Planned Cooling-Capacity Visibility · <= 95 Percent ↗
Applies to: Chiller Plant Electrical and BAS Coordination
BAS coordination planning — up to 95 percent plant cooling-capacity visibility as planning / source language.
Design parameter · Design material requirement
Trench Pour-Back Concrete Strength · 4,000 psi ↗
Applies to: 480V Secondary Service, DP-PKG Feeder, and Phase 2-Ready Electrical Expansion
4000 psi trench pour-back
Equipment rating · Network architecture capacity
East-West OT Backbone Data Rate · 10 Gbps ↗
Applies to: Fiberoptic OT Network Phase 1 and Phase 2, Configuration and Cutover Execution
10 Gbps backbone
Design parameter · Design parameter
Drainage-Channel Design Slope · 4 % ↗
Applies to: Full Drainage Channel & Weir System
4% slope
Design parameter · Remediation quantity basis
Phase 1 Void-Fill Length · 85 ft ↗
Applies to: Phase 1 Drainage Remediation
85 ft x 4 ft x 2 ft flowable fill void fill
Design parameter · Remediation quantity basis
Phase 1 Void-Fill Width · 4 ft ↗
Applies to: Phase 1 Drainage Remediation
85 ft x 4 ft x 2 ft flowable fill void fill
Design parameter · Remediation quantity basis
Phase 1 Void-Fill Depth · 2 ft ↗
Applies to: Phase 1 Drainage Remediation
85 ft x 4 ft x 2 ft flowable fill void fill
Design parameter · Design capacity
Duplex Lift-Station Design Flow · 100 GPM ↗
Applies to: Wastewater Tanks and Collection System
100 GPM lift stations
Equipment rating · Equipment rating
Wastewater Pump Motor Rating · 5 Hp ↗
Applies to: Wastewater Tanks and Collection System
5 hp pumps
Design parameter · Design parameter
Drainage-Channel Design Slope · 4 % ↗
Applies to: Drainage, weir and debris-screen design details
4% slope
Design parameter · Design dimension
Outlet Basin Length · 10 ft ↗
Applies to: Drainage, weir and debris-screen design details
10 ft x 15 ft x 2 ft basin
Design parameter · Design dimension
Outlet Basin Width · 15 ft ↗
Applies to: Drainage, weir and debris-screen design details
10 ft x 15 ft x 2 ft basin
Design parameter · Design dimension
Outlet Basin Depth · 2 ft ↗
Applies to: Drainage, weir and debris-screen design details
10 ft x 15 ft x 2 ft basin
Estimate · Estimate allowance
Phase 1 Stabilization Contingency · 10 % ↗
Applies to: Drainage, weir and debris-screen design details
~ Phase 1 package with 10% contingency.
Scenario or model result · Planning assumption
Growth CAGR · 3 % ↗
Applies to: Five-Year Capital Planning and Asset Lifecycle Roadmap
3% CAGR assumption
Scenario or model result · Selected capstone scenario validation
Trip-Feasibility Matching · 100 Percent ↗
Applies to: Theme-park operator bus-optimization capstone
Three selected scenarios — 100 percent trip-feasibility matching
Design parameter · Process design context
Fermentation Duration · 5 to 7 Days ↗
Applies to: Mapped rice receiving and milling through pressure-vessel cooking, fermentation, buffer and pH tanks, filter presses, pasteurization, storage and drum packaging
Rice-room process — Fermentation duration — Rice-room process
Design parameter · Product context
Cooking-Wine Alcohol Content · 12 % ↗
Applies to: Mapped rice receiving and milling through pressure-vessel cooking, fermentation, buffer and pH tanks, filter presses, pasteurization, storage and drum packaging
Rice cooking wine — Cooking-wine alcohol content — Rice cooking wine
Design parameter · Vendor laboratory test condition
Acetic Acid Sample Volume · 100 ML ↗
Applies to: Filtration supplier tested dilute sodium-hydroxide neutralization of residual acetic acid at laboratory scale; the study found no identified crystal-like particulate and recommended production validation
Acid sample — Acetic acid sample volume — Acid sample
Design parameter · Vendor laboratory test condition
Acetic Acid Concentration · 20 % ↗
Applies to: Filtration supplier tested dilute sodium-hydroxide neutralization of residual acetic acid at laboratory scale; the study found no identified crystal-like particulate and recommended production validation
Acid sample — Acetic acid concentration — Acid sample
Observation · Vendor laboratory result
Sodium Hydroxide Volume · 660 ML ↗
Applies to: Filtration supplier tested dilute sodium-hydroxide neutralization of residual acetic acid at laboratory scale; the study found no identified crystal-like particulate and recommended production validation
Neutralizing solution — Sodium hydroxide volume — Neutralizing solution
Design parameter · Vendor laboratory test condition
Sodium Hydroxide Concentration · 2 % ↗
Applies to: Filtration supplier tested dilute sodium-hydroxide neutralization of residual acetic acid at laboratory scale; the study found no identified crystal-like particulate and recommended production validation
Neutralizing solution — Sodium hydroxide concentration — Neutralizing solution
Design parameter · Vendor laboratory test condition
Reagent Dosing Rate · 60 ML/Min ↗
Applies to: Filtration supplier tested dilute sodium-hydroxide neutralization of residual acetic acid at laboratory scale; the study found no identified crystal-like particulate and recommended production validation
Neutralization — Reagent dosing rate — Neutralization
Observation · Vendor laboratory result
Temperature Increase · 3 °F ↗
Applies to: Filtration supplier tested dilute sodium-hydroxide neutralization of residual acetic acid at laboratory scale; the study found no identified crystal-like particulate and recommended production validation
Neutralization — Approximately 3°F temperature increase, reported with ±1°F in the filtration supplier report, within one minute of dosing; membrane tolerance remained to be validated.
Observation · Vendor laboratory result
Total Suspended Solids · 106 Mg/L ↗
Applies to: Filtration supplier tested dilute sodium-hydroxide neutralization of residual acetic acid at laboratory scale; the study found no identified crystal-like particulate and recommended production validation
Before neutralization — Total suspended solids — Before neutralization
Observation · Vendor laboratory result
Total Suspended Solids · 108 Mg/L ↗
Applies to: Filtration supplier tested dilute sodium-hydroxide neutralization of residual acetic acid at laboratory scale; the study found no identified crystal-like particulate and recommended production validation
After neutralization — Total suspended solids — After neutralization
Observation · Vendor laboratory result
pH · 7 to 8 pH Units ↗
Applies to: Filtration supplier tested dilute sodium-hydroxide neutralization of residual acetic acid at laboratory scale; the study found no identified crystal-like particulate and recommended production validation
After neutralization — pH — After neutralization
Baseline · Vendor laboratory baseline
Membrane Flux · 138 L/M²/H ↗
Applies to: Reviewed the vendor filterability study as a design baseline for ceramic filtration: membrane flux, pore size, clean-water-flux recovery after CIP and filtrate turbidity
study, 2018 — Membrane flux — study, 2018
Equipment rating · Vendor laboratory membrane specification
Membrane Pore Size · 0.2 µM ↗
Applies to: Reviewed the vendor filterability study as a design baseline for ceramic filtration: membrane flux, pore size, clean-water-flux recovery after CIP and filtrate turbidity
study, 2018 — Membrane pore size — study, 2018
Observation · Field observation
CIP Flush Volume · Approximately 6,000 Gal ↗
Applies to: Captured a complete ceramic-CIP waste stream, organized repeated multi-point sampling, and coordinated the wastewater receiver, internal stakeholders, filtration supplier and laboratories
Ceramic-CIP flush — CIP flush volume — Ceramic-CIP flush
Operating control · Receiver criterion
Wastewater Flow · 10,000 to 15,000 GPD ↗
Applies to: Developed temporary containment and dilution measures and evaluated permanent alternatives against receiving-facility hydraulic, pH and sodium criteria
Receiving facility — Wastewater flow — Receiving facility
Operating control · Receiver criterion
pH · > 3 pH Units ↗
Applies to: Developed temporary containment and dilution measures and evaluated permanent alternatives against receiving-facility hydraulic, pH and sodium criteria
Receiving facility — pH — Receiving facility
Operating control · Receiver criterion
Sodium Concentration · < 160 Ppm ↗
Applies to: Developed temporary containment and dilution measures and evaluated permanent alternatives against receiving-facility hydraulic, pH and sodium criteria
Receiving facility — Sodium concentration — Receiving facility
Observation · Field observation
Wastewater Flow · 30,000 to 40,000 GPD ↗
Applies to: Captured a complete ceramic-CIP waste stream, organized repeated multi-point sampling, and coordinated the wastewater receiver, internal stakeholders, filtration supplier and laboratories
Contemporaneous plant sampling — Wastewater flow — Contemporaneous plant sampling
Observation · Field observation
pH · 2 to 3 pH Units ↗
Applies to: Captured a complete ceramic-CIP waste stream, organized repeated multi-point sampling, and coordinated the wastewater receiver, internal stakeholders, filtration supplier and laboratories
Contemporaneous plant sampling — pH — Contemporaneous plant sampling
Observation · Field observation
Sodium Concentration · 189 Ppm ↗
Applies to: Captured a complete ceramic-CIP waste stream, organized repeated multi-point sampling, and coordinated the wastewater receiver, internal stakeholders, filtration supplier and laboratories
Contemporaneous plant sampling — Sodium concentration — Contemporaneous plant sampling
Observation · Bench observation
Acidity · 200.8 Grain ↗
Applies to: Compared the bench-test acidity, transmittance, color and turbidity results to evaluate decolorization and product effects
WDV — Before treatment — Acidity — WDV — Before treatment
Observation · Bench observation
Acidity · 173.2 Grain ↗
Applies to: Compared the bench-test acidity, transmittance, color and turbidity results to evaluate decolorization and product effects
WDV — After treatment — Acidity — WDV — After treatment
Observation · Bench observation
Transmittance · 96.8 % ↗
Applies to: Compared the bench-test acidity, transmittance, color and turbidity results to evaluate decolorization and product effects
WDV — Before treatment — Transmittance — WDV — Before treatment
Observation · Bench observation
Transmittance · 99.5 % ↗
Applies to: Compared the bench-test acidity, transmittance, color and turbidity results to evaluate decolorization and product effects
WDV — After treatment — Transmittance — WDV — After treatment
Observation · Bench observation
Turbidity · 0.692 NTU ↗
Applies to: Compared the bench-test acidity, transmittance, color and turbidity results to evaluate decolorization and product effects
WDV — Before treatment — Turbidity — WDV — Before treatment
Observation · Bench observation
Turbidity · 0.505 NTU ↗
Applies to: Compared the bench-test acidity, transmittance, color and turbidity results to evaluate decolorization and product effects
WDV — After treatment — Turbidity — WDV — After treatment
Observation · Bench observation
Acidity · 111.6 Grain ↗
Applies to: Compared the bench-test acidity, transmittance, color and turbidity results to evaluate decolorization and product effects
Rice vinegar — Before treatment — Acidity — Rice vinegar — Before treatment
Observation · Bench observation
Acidity · 92.5 Grain ↗
Applies to: Compared the bench-test acidity, transmittance, color and turbidity results to evaluate decolorization and product effects
Rice vinegar — After treatment — Acidity — Rice vinegar — After treatment
Observation · Bench observation
Color · 0.794 Reported Color Value ↗
Applies to: Compared the bench-test acidity, transmittance, color and turbidity results to evaluate decolorization and product effects
Rice vinegar — Before treatment — Color — Rice vinegar — Before treatment
Observation · Bench observation
Color · 0.176 Reported Color Value ↗
Applies to: Compared the bench-test acidity, transmittance, color and turbidity results to evaluate decolorization and product effects
Rice vinegar — After treatment — Color — Rice vinegar — After treatment
Observation · Bench observation
Turbidity · 1.92 NTU ↗
Applies to: Compared the bench-test acidity, transmittance, color and turbidity results to evaluate decolorization and product effects
Rice vinegar — Before treatment — Turbidity — Rice vinegar — Before treatment
Observation · Bench observation
Turbidity · 1.06 NTU ↗
Applies to: Compared the bench-test acidity, transmittance, color and turbidity results to evaluate decolorization and product effects
Rice vinegar — After treatment — Turbidity — Rice vinegar — After treatment
Scope or inventory quantity · Analysis scope
Sizing Workbook Sheets · 9 Sheets ↗
Applies to: Developed exploratory bed-volume, column, pump, batch and resin calculations; identified formula-error cells for correction before final sizing
Exploratory sizing — Sizing workbook sheets — Exploratory sizing
Design parameter · Sample specification
Feed Alcohol Content · 16 % ↗
Applies to: Defined and submitted the unfiltered rice-wine sample and process basis to decanter supplier, including the recovery target for a feasibility study
Unfiltered rice wine after fermentation — Feed alcohol content — Unfiltered rice wine after fermentation
Case: Rice Wine Decanter Trial
Design parameter · Design basis
Process Flow Basis · 7,000 GPD ↗
Applies to: Defined and submitted the unfiltered rice-wine sample and process basis to decanter supplier, including the recovery target for a feasibility study
Feasibility submission — Process flow basis — Feasibility submission
Case: Rice Wine Decanter Trial
Target · Trial target
Product Recovery · > 90 % ↗
Applies to: Defined and submitted the unfiltered rice-wine sample and process basis to decanter supplier, including the recovery target for a feasibility study
Feasibility submission — Product recovery — Feasibility submission
Case: Rice Wine Decanter Trial
Observation · Vendor laboratory result
pH · 4 pH Units ↗
Applies to: Decanter supplier characterized the rice-wine sample, varied g-force and residence time, found decanter and sedicanter separation feasible, and recommended dynamic pilot testing at the required clarity and throughput
Decanter supplier rice-wine sample, 20 August 2024 — pH — Decanter supplier rice-wine sample, 20 August 2024
Case: Rice Wine Decanter Trial
Observation · Vendor laboratory result
Brix · 12 °Bx ↗
Applies to: Decanter supplier characterized the rice-wine sample, varied g-force and residence time, found decanter and sedicanter separation feasible, and recommended dynamic pilot testing at the required clarity and throughput
Decanter supplier rice-wine sample, 20 August 2024 — Brix — Decanter supplier rice-wine sample, 20 August 2024
Case: Rice Wine Decanter Trial
Observation · Vendor laboratory result
Density · 1.007 g/ML ↗
Applies to: Decanter supplier characterized the rice-wine sample, varied g-force and residence time, found decanter and sedicanter separation feasible, and recommended dynamic pilot testing at the required clarity and throughput
Decanter supplier rice-wine sample, 20 August 2024 — Density — Decanter supplier rice-wine sample, 20 August 2024
Case: Rice Wine Decanter Trial
Observation · Vendor laboratory result
Total Solids · 8.47 % ↗
Applies to: Decanter supplier characterized the rice-wine sample, varied g-force and residence time, found decanter and sedicanter separation feasible, and recommended dynamic pilot testing at the required clarity and throughput
Decanter supplier rice-wine sample, 20 August 2024 — Total solids — Decanter supplier rice-wine sample, 20 August 2024
Case: Rice Wine Decanter Trial
Observation · Vendor laboratory result
Suspended Solids · 3.06 % ↗
Applies to: Decanter supplier characterized the rice-wine sample, varied g-force and residence time, found decanter and sedicanter separation feasible, and recommended dynamic pilot testing at the required clarity and throughput
Decanter supplier rice-wine sample, 20 August 2024 — Suspended solids — Decanter supplier rice-wine sample, 20 August 2024
Case: Rice Wine Decanter Trial
Observation · Vendor laboratory result
Dissolved Solids · 5.41 % ↗
Applies to: Decanter supplier characterized the rice-wine sample, varied g-force and residence time, found decanter and sedicanter separation feasible, and recommended dynamic pilot testing at the required clarity and throughput
Decanter supplier rice-wine sample, 20 August 2024 — Dissolved solids — Decanter supplier rice-wine sample, 20 August 2024
Case: Rice Wine Decanter Trial
Observation · Vendor laboratory result
Spin Index · 2.2 Reported Index ↗
Applies to: Decanter supplier characterized the rice-wine sample, varied g-force and residence time, found decanter and sedicanter separation feasible, and recommended dynamic pilot testing at the required clarity and throughput
Decanter supplier rice-wine sample, 20 August 2024 — Spin index — Decanter supplier rice-wine sample, 20 August 2024
Case: Rice Wine Decanter Trial
Design parameter · Vendor proposal
Bowl Diameter · 14.5 in ↗
Applies to: Evaluated the C3E 4/454 proposal as a capital option, including the two-phase bowl and scroll, contact materials, wear protection, drives, controls, monitoring, optional feed/centrate integration and commercial schedule
Bowl — Bowl diameter — Bowl
Case: Rice Wine Decanter Trial
Equipment rating · Vendor proposal
Rotational Speed · <= 4,000 rpm ↗
Applies to: Evaluated the C3E 4/454 proposal as a capital option, including the two-phase bowl and scroll, contact materials, wear protection, drives, controls, monitoring, optional feed/centrate integration and commercial schedule
Rated maximum — Rotational speed — Rated maximum
Case: Rice Wine Decanter Trial
Equipment rating · Vendor proposal
Centrifugal Acceleration · <= 3,300 g ↗
Applies to: Evaluated the C3E 4/454 proposal as a capital option, including the two-phase bowl and scroll, contact materials, wear protection, drives, controls, monitoring, optional feed/centrate integration and commercial schedule
Rated maximum — Centrifugal acceleration — Rated maximum
Case: Rice Wine Decanter Trial
Equipment rating · Vendor proposal
Motor Power · 20 HP ↗
Applies to: Evaluated the C3E 4/454 proposal as a capital option, including the two-phase bowl and scroll, contact materials, wear protection, drives, controls, monitoring, optional feed/centrate integration and commercial schedule
Bowl drive — Motor power — Bowl drive
Case: Rice Wine Decanter Trial
Equipment rating · Vendor proposal
Motor Power · 5 HP ↗
Applies to: Evaluated the C3E 4/454 proposal as a capital option, including the two-phase bowl and scroll, contact materials, wear protection, drives, controls, monitoring, optional feed/centrate integration and commercial schedule
Scroll drive — Motor power — Scroll drive
Case: Rice Wine Decanter Trial
Design parameter · Vendor proposal
HMI Display Size · 10 in ↗
Applies to: Evaluated the C3E 4/454 proposal as a capital option, including the two-phase bowl and scroll, contact materials, wear protection, drives, controls, monitoring, optional feed/centrate integration and commercial schedule
operator display — HMI display size — operator display
Case: Rice Wine Decanter Trial
Estimate · Vendor proposal
Engineering Submittal Lead Time · 10 Weeks ↗
Applies to: Evaluated the C3E 4/454 proposal as a capital option, including the two-phase bowl and scroll, contact materials, wear protection, drives, controls, monitoring, optional feed/centrate integration and commercial schedule
After order acceptance — Engineering submittal lead time — After order acceptance
Case: Rice Wine Decanter Trial
Quotation · Vendor proposal
Onsite Service Allowance · 10 Days ↗
Applies to: Evaluated the C3E 4/454 proposal as a capital option, including the two-phase bowl and scroll, contact materials, wear protection, drives, controls, monitoring, optional feed/centrate integration and commercial schedule
Proposal service — Onsite service allowance — Proposal service
Case: Rice Wine Decanter Trial
Estimate · Vendor proposal
Equipment Delivery Lead Time · 30 to 34 Weeks ↗
Applies to: Evaluated the C3E 4/454 proposal as a capital option, including the two-phase bowl and scroll, contact materials, wear protection, drives, controls, monitoring, optional feed/centrate integration and commercial schedule
After order acceptance — Equipment delivery lead time — After order acceptance
Case: Rice Wine Decanter Trial
Target · Planned trial input
Active Test Duration · 3 Days ↗
Applies to: Specified a planned three-day trial using an existing 60 A three-phase circuit and filter-press feed pump, temporary sanitary product/CIP/waste connections, and approximately 250 gallons of 1% caustic at 140°F prepared in the existing filter feed tank; a separate modified tote captures solids
Planned active trial — Active test duration — Planned active trial
Case: Rice Wine Decanter Trial
Equipment rating · Planned trial input
Temporary Electrical Circuit · 60 A ↗
Applies to: Specified a planned three-day trial using an existing 60 A three-phase circuit and filter-press feed pump, temporary sanitary product/CIP/waste connections, and approximately 250 gallons of 1% caustic at 140°F prepared in the existing filter feed tank; a separate modified tote captures solids
Existing three-phase supply — Temporary electrical circuit — Existing three-phase supply
Case: Rice Wine Decanter Trial
Design parameter · Planned trial input
CIP Solution Volume · 250 Gal ↗
Applies to: Specified a planned three-day trial using an existing 60 A three-phase circuit and filter-press feed pump, temporary sanitary product/CIP/waste connections, and approximately 250 gallons of 1% caustic at 140°F prepared in the existing filter feed tank; a separate modified tote captures solids
Planned trial cleaning — CIP solution volume — Planned trial cleaning
Case: Rice Wine Decanter Trial
Target · Planned trial input
Post-Order Implementation Window · 3 to 4 Weeks ↗
Applies to: Compared an estimated 50–75% capital-cost advantage and four-to-five-times longer rebuild intervals with separator-style alternatives, alongside a planned three-to-four-week post-order pilot window
Pilot preparation — Post-order implementation window — Pilot preparation
Case: Rice Wine Decanter Trial
Estimate · Estimated option benefit
Rebuild Interval Multiplier · 4 to 5 Times ↗
Applies to: Compared an estimated 50–75% capital-cost advantage and four-to-five-times longer rebuild intervals with separator-style alternatives, alongside a planned three-to-four-week post-order pilot window
Compared with separator alternatives — Rebuild interval multiplier — Compared with separator alternatives
Case: Rice Wine Decanter Trial
Baseline · Historical design basis
Existing Acetators · 7 Units ↗
Applies to: Related the acetator expansion to the existing production base, WDV supply deficit, interplant freight and air-emission requirements for new and existing equipment
Pre-expansion — Existing acetators — Pre-expansion
Case: Acetator ExpansionProject: Acetator Expansion
Baseline · Historical design basis
Average WDV Production · 13,700,000 Gal/Year ↗
Applies to: Related the acetator expansion to the existing production base, WDV supply deficit, interplant freight and air-emission requirements for new and existing equipment
Prior three-year average — Average WDV production — Prior three-year average
Case: Acetator ExpansionProject: Acetator Expansion
Estimate · Forecast
WDV Supply Shortage · 1,200,000 Gal/Year ↗
Applies to: Related the acetator expansion to the existing production base, WDV supply deficit, interplant freight and air-emission requirements for new and existing equipment
2020 forecast — WDV supply shortage — 2020 forecast
Case: Acetator ExpansionProject: Acetator Expansion
Scope or inventory quantity · Design scope
New Scrubbers · 3 Units ↗
Applies to: Related the acetator expansion to the existing production base, WDV supply deficit, interplant freight and air-emission requirements for new and existing equipment
New and existing acetators — New scrubbers — New and existing acetators
Case: Acetator ExpansionProject: Acetator Expansion
Equipment rating · Design specification
Acetator Drive Power · 50 HP ↗
Applies to: Related the acetator expansion to the existing production base, WDV supply deficit, interplant freight and air-emission requirements for new and existing equipment
Each new acetator — Acetator supplier drive power — Each new acetator
Case: Acetator ExpansionProject: Acetator Expansion
Operating control · Discharge criterion
BOD Allowance · 500 lb/Day ↗
Applies to: Related vinegar recovery and pH-treatment changes to wastewater BOD loading, discharge limits and historical surcharges
City receiver — BOD allowance — City receiver
Observation · Historical observation
BOD Exceedance Months · 7 Months ↗
Applies to: Related vinegar recovery and pH-treatment changes to wastewater BOD loading, discharge limits and historical surcharges
12-month review — BOD exceedance months — 12-month review
Observation · Historical observation
Waste-Volume Exceedance Months · 11 Months ↗
Applies to: Related vinegar recovery and pH-treatment changes to wastewater BOD loading, discharge limits and historical surcharges
12-month review — Waste-volume exceedance months — 12-month review
Baseline · Historical design basis
Weekly Discarded Vinegar and Sludge · 2,000 Gal/Week ↗
Applies to: Related vinegar recovery and pH-treatment changes to wastewater BOD loading, discharge limits and historical surcharges
Membrane supplier cleaning — Weekly discarded vinegar and sludge — Membrane supplier cleaning
Estimate · Projected benefit
pH-Treatment Cost Reduction · 54,000 USD/Year ↗
Applies to: Related vinegar recovery and pH-treatment changes to wastewater BOD loading, discharge limits and historical surcharges
AFE option — pH-treatment cost reduction — AFE option
Estimate · Projected benefit
Combined Savings · 108,407 USD/Year ↗
Applies to: Related vinegar recovery and pH-treatment changes to wastewater BOD loading, discharge limits and historical surcharges
AFE option — Combined savings — AFE option
Baseline · Historical process context
Bentonite-Treated Production Share · 75 % ↗
Applies to: Separated filtration processing time from unattended bentonite-treatment elapsed time when evaluating post-formulation-change capacity and filter-aid demand
Post-formulation-change treatment — Bentonite-treated production share — Post-formulation-change treatment
Baseline · Historical process context
Untreated Production Share · 25 % ↗
Applies to: Separated filtration processing time from unattended bentonite-treatment elapsed time when evaluating post-formulation-change capacity and filter-aid demand
Post-formulation-change treatment — Untreated production share — Post-formulation-change treatment
Baseline · Historical process context
Treatment and Processing Elapsed Time · 49 Hours ↗
Applies to: Separated filtration processing time from unattended bentonite-treatment elapsed time when evaluating post-formulation-change capacity and filter-aid demand
Includes unattended treatment; not labor hours — Treatment and processing elapsed time — Includes unattended treatment; not labor hours
Target · Schedule target
Post-Order Completion Window · 12 Weeks ↗
Applies to: Defined filtration quality, capacity and filter-aid cost criteria for the centrifuge option and its post-purchase-order completion plan
AFE acceptance plan — Post-order completion window — AFE acceptance plan
Baseline · Historical design basis
Existing Chillers · 5 Units ↗
Applies to: Defined standby cooling and power renewal around full utilization, no spare chiller capacity, and two aging high-current feeds
Pre-upgrade cooling plant — Existing chillers — Pre-upgrade cooling plant
Baseline · Historical design basis
Existing Power Feeds · 2 Feeds ↗
Applies to: Defined standby cooling and power renewal around full utilization, no spare chiller capacity, and two aging high-current feeds
Primary acetator chillers — Existing power feeds — Primary acetator chillers
Equipment rating · Historical design basis
Existing Feed Current Rating · 600 A ↗
Applies to: Defined standby cooling and power renewal around full utilization, no spare chiller capacity, and two aging high-current feeds
Each aging feed — Existing feed current rating — Each aging feed
Estimate · Schedule allowance
Common Cooling Shutdown · 2 Days ↗
Applies to: Planned common cooling work and sequential unit outages for A5/A6/A7, contractor exclusion zones and tanker-loading fall-arrest recertification
All affected units — Common cooling shutdown — All affected units
Case: Acetator ExpansionProject: Acetator Expansion
Estimate · Schedule allowance
Unit Conversion Shutdown · 9 Days/Unit ↗
Applies to: Planned common cooling work and sequential unit outages for A5/A6/A7, contractor exclusion zones and tanker-loading fall-arrest recertification
Each of A5, A6 and A7 — Unit conversion shutdown — Each of A5, A6 and A7
Case: Acetator ExpansionProject: Acetator Expansion
Estimate · Estimated production exposure
Conversion Production Loss · 270,000 100-Grain Gal ↗
Applies to: Planned common cooling work and sequential unit outages for A5/A6/A7, contractor exclusion zones and tanker-loading fall-arrest recertification
Planned conversion outages — Conversion production loss — Planned conversion outages
Case: Acetator ExpansionProject: Acetator Expansion
Scope or inventory quantity · Design scope
Pressure-Measurement Device Count · 12 Units ↗
Applies to: Specified pressure-based tank measurement connected to a centralized PLC and standardized vendor/service support for inventory visibility
Tank measurement deployment — Pressure measurement units — Tank measurement deployment
Estimate · Schedule allowance
Relocation Outage Allowance · 1 Weeks ↗
Applies to: Planned critical spares and supplier follow-up for an unbacked filtration system and inventory coverage during relocation of a leased unit
Leased filter permanent-position relocation — Relocation outage allowance — Leased filter permanent-position relocation
Estimate · Supplier estimate
PET Mold Change-Part Lead Time · 8 to 10 Weeks ↗
Applies to: Coordinated the 28 mm PCO conversion through mold procurement, change parts, pick-plate and closure handling, bottle-format tooling and neck-support centering risks
Bottle conversion — PET mold change-part lead time — Bottle conversion
Estimate · Supplier estimate
Equipment Change-Part Lead Time · 10 to 14 Weeks ↗
Applies to: Coordinated the 28 mm PCO conversion through mold procurement, change parts, pick-plate and closure handling, bottle-format tooling and neck-support centering risks
Bottle conversion — Equipment change-part lead time — Bottle conversion
Design parameter · Design compatibility range
Below-Support-Ring Diameter · 25.4 to 26.77 mm ↗
Applies to: Coordinated the 28 mm PCO conversion through mold procurement, change parts, pick-plate and closure handling, bottle-format tooling and neck-support centering risks
Five 1810 bottle formats — Below-support-ring diameter — Five 1810 bottle formats
Scope or inventory quantity · Configuration scope
VLAN Definitions · 5 VLANs ↗
Applies to: Used AI-assisted comparison of field observations and managed-switch configuration to detect port-state and labeling discrepancies and prepare a staged configuration baseline
LAL-23 staged baseline — VLAN definitions — LAL-23 staged baseline
Scope or inventory quantity · Configuration scope
Access-Port Definitions · 8 Ports ↗
Applies to: Used AI-assisted comparison of field observations and managed-switch configuration to detect port-state and labeling discrepancies and prepare a staged configuration baseline
LAL-23 staged baseline — Access-port definitions — LAL-23 staged baseline
Scope or inventory quantity · Configuration scope
Independent Trunk Definitions · 2 Trunks ↗
Applies to: Used AI-assisted comparison of field observations and managed-switch configuration to detect port-state and labeling discrepancies and prepare a staged configuration baseline
LAL-23 staged baseline — Independent trunk definitions — LAL-23 staged baseline
Scope or inventory quantity · Analysis scope
Risk Dimensions · 6 Dimensions ↗
Applies to: Used AI to review two PDFs, prepare AFE content, revise an option study and organize risk countermeasures across quality, cost/write-off, permitting, safety, environment and technical coordination
LAL-25 risk matrix — Risk dimensions — LAL-25 risk matrix
Scope or inventory quantity · Historical package output
Artifact Taxonomy · 73 Rows ↗
Applies to: Directed AI-assisted development of a reusable source-to-model package with artifact taxonomy, request decomposition, human/assistant responsibilities, translation workflow, conformance review, hashing and visual/package validation
AC-121 translation package — Artifact taxonomy — AC-121 translation package
Scope or inventory quantity · Historical package output
Request Groups · 29 Groups ↗
Applies to: Directed AI-assisted development of a reusable source-to-model package with artifact taxonomy, request decomposition, human/assistant responsibilities, translation workflow, conformance review, hashing and visual/package validation
AC-121 translation package — Request groups — AC-121 translation package
Scope or inventory quantity · Historical package output
Responsibility Allocations · 34 Records ↗
Applies to: Directed AI-assisted development of a reusable source-to-model package with artifact taxonomy, request decomposition, human/assistant responsibilities, translation workflow, conformance review, hashing and visual/package validation
AC-121 translation package — Responsibility allocations — AC-121 translation package
Scope or inventory quantity · Historical package output
Workflow Stages · 36 Stages ↗
Applies to: Directed AI-assisted development of a reusable source-to-model package with artifact taxonomy, request decomposition, human/assistant responsibilities, translation workflow, conformance review, hashing and visual/package validation
AC-121 translation package — Workflow stages — AC-121 translation package
Scope or inventory quantity · Historical package output
Visually Reviewed Guide · 43 Pages ↗
Applies to: Directed AI-assisted development of a reusable source-to-model package with artifact taxonomy, request decomposition, human/assistant responsibilities, translation workflow, conformance review, hashing and visual/package validation
AC-121 translation package — Visually reviewed guide — AC-121 translation package
Scope or inventory quantity · Historical audit scope
Physical Files · 22 Files ↗
Applies to: Used AI-assisted review and deterministic file checks to reconcile physical files to unique byte streams, detect duplicate groups and missing indexed KPAR members, and retain the failed audit result
Related conformance audit — Physical files — Related conformance audit
Scope or inventory quantity · Historical audit scope
Unique Byte Streams · 20 Files ↗
Applies to: Used AI-assisted review and deterministic file checks to reconcile physical files to unique byte streams, detect duplicate groups and missing indexed KPAR members, and retain the failed audit result
Related conformance audit — Unique byte streams — Related conformance audit
Scope or inventory quantity · Historical package output
Package Files · 141 Files ↗
Applies to: Directed AI-assisted production of the SysML v2.3 delivery package, linking approved engineering information to model elements, views and deterministic validation results
SysML v2.3 — Package files — SysML v2.3
Scope or inventory quantity · Historical package output
CSV Files · 85 Files ↗
Applies to: Directed AI-assisted production of the SysML v2.3 delivery package, linking approved engineering information to model elements, views and deterministic validation results
SysML v2.3 — CSV files — SysML v2.3
Scope or inventory quantity · Historical package output
JSON Files · 14 Files ↗
Applies to: Directed AI-assisted production of the SysML v2.3 delivery package, linking approved engineering information to model elements, views and deterministic validation results
SysML v2.3 — JSON files — SysML v2.3
Scope or inventory quantity · Historical package output
Python Files · 7 Files ↗
Applies to: Directed AI-assisted production of the SysML v2.3 delivery package, linking approved engineering information to model elements, views and deterministic validation results
SysML v2.3 — Python files — SysML v2.3
Scope or inventory quantity · Historical package output
Guide Length · 36 Pages ↗
Applies to: Directed AI-assisted production of the SysML v2.3 delivery package, linking approved engineering information to model elements, views and deterministic validation results
SysML v2.3 — Guide length — SysML v2.3
Scope or inventory quantity · Historical model output
Part Definitions · 279 Model Elements ↗
Applies to: Directed AI-assisted development of the PMF-001 semantic-completeness augmentation for engineering review, representing parts, actions, parameters, item usage and sequence transfers
PMF-001 augmentation v2.0.0 — Part definitions — PMF-001 augmentation v2.0.0
Scope or inventory quantity · Historical model output
Part Usages · 345 Model Elements ↗
Applies to: Directed AI-assisted development of the PMF-001 semantic-completeness augmentation for engineering review, representing parts, actions, parameters, item usage and sequence transfers
PMF-001 augmentation v2.0.0 — Part usages — PMF-001 augmentation v2.0.0
Scope or inventory quantity · Historical model output
Actions · 680 Model Elements ↗
Applies to: Directed AI-assisted development of the PMF-001 semantic-completeness augmentation for engineering review, representing parts, actions, parameters, item usage and sequence transfers
PMF-001 augmentation v2.0.0 — Actions — PMF-001 augmentation v2.0.0
Scope or inventory quantity · Historical model output
Action Parameters · 1,863 Model Elements ↗
Applies to: Directed AI-assisted development of the PMF-001 semantic-completeness augmentation for engineering review, representing parts, actions, parameters, item usage and sequence transfers
PMF-001 augmentation v2.0.0 — Action parameters — PMF-001 augmentation v2.0.0
Scope or inventory quantity · Historical model output
Item Usages · 1,015 Model Elements ↗
Applies to: Directed AI-assisted development of the PMF-001 semantic-completeness augmentation for engineering review, representing parts, actions, parameters, item usage and sequence transfers
PMF-001 augmentation v2.0.0 — Item usages — PMF-001 augmentation v2.0.0
Scope or inventory quantity · Historical model output
Sequence Transfers · 536 Model Elements ↗
Applies to: Directed AI-assisted development of the PMF-001 semantic-completeness augmentation for engineering review, representing parts, actions, parameters, item usage and sequence transfers
PMF-001 augmentation v2.0.0 — Sequence transfers — PMF-001 augmentation v2.0.0
Scope or inventory quantity · Historical reconstruction output
Evidence Records · 474,672 Records ↗
Applies to: Applied AI-assisted evidence review and deterministic extraction, canonicalization and workbook checks to reconcile the eight food-products project histories while preserving their separate ownership and financial meaning
Eight-project Food ingredients manufacturer reconstruction — Evidence records — Eight-project Food ingredients manufacturer reconstruction
Scope or inventory quantity · Historical reconstruction output
Document Identities and Hashes · 614 Documents ↗
Applies to: Applied AI-assisted evidence review and deterministic extraction, canonicalization and workbook checks to reconcile the eight food-products project histories while preserving their separate ownership and financial meaning
Eight-project Food ingredients manufacturer reconstruction — Document identities and hashes — Eight-project Food ingredients manufacturer reconstruction
Scope or inventory quantity · Historical reconstruction output
Workbook Checks Passed · 18 Checks ↗
Applies to: Applied AI-assisted evidence review and deterministic extraction, canonicalization and workbook checks to reconcile the eight food-products project histories while preserving their separate ownership and financial meaning
Eight-project Food ingredients manufacturer reconstruction — Workbook checks passed — Eight-project Food ingredients manufacturer reconstruction
Scope or inventory quantity · Historical reconstruction output
Source Record · 16 Sheets ↗
Applies to: Applied AI-assisted evidence review and deterministic extraction, canonicalization and workbook checks to reconcile the eight food-products project histories while preserving their separate ownership and financial meaning
Eight-project Food ingredients manufacturer reconstruction — source record — Eight-project Food ingredients manufacturer reconstruction
Scope or inventory quantity · Historical reconstruction output
OOXML Table Parts · 17 Tables ↗
Applies to: Applied AI-assisted evidence review and deterministic extraction, canonicalization and workbook checks to reconcile the eight food-products project histories while preserving their separate ownership and financial meaning
Eight-project Food ingredients manufacturer reconstruction — OOXML table parts — Eight-project Food ingredients manufacturer reconstruction
Scope or inventory quantity · Historical reconstruction output
Populated Cells · 46,678 Cells ↗
Applies to: Applied AI-assisted evidence review and deterministic extraction, canonicalization and workbook checks to reconcile the eight food-products project histories while preserving their separate ownership and financial meaning
Eight-project Food ingredients manufacturer reconstruction — Populated cells — Eight-project Food ingredients manufacturer reconstruction
Scope or inventory quantity · Historical reconstruction output
Formulas · 2,446 Formulas ↗
Applies to: Applied AI-assisted evidence review and deterministic extraction, canonicalization and workbook checks to reconcile the eight food-products project histories while preserving their separate ownership and financial meaning
Eight-project Food ingredients manufacturer reconstruction — Formulas — Eight-project Food ingredients manufacturer reconstruction
Scope or inventory quantity · Historical reconstruction output
Execution Records per Project · 362 Records/Project ↗
Applies to: Applied AI-assisted evidence review and deterministic extraction, canonicalization and workbook checks to reconcile the eight food-products project histories while preserving their separate ownership and financial meaning
Eight-project Food ingredients manufacturer reconstruction — Execution records per project — Eight-project Food ingredients manufacturer reconstruction
Scope or inventory quantity · Historical reconstruction output
Execution Records Across Projects · 2,896 Records ↗
Applies to: Applied AI-assisted evidence review and deterministic extraction, canonicalization and workbook checks to reconcile the eight food-products project histories while preserving their separate ownership and financial meaning
Eight-project Food ingredients manufacturer reconstruction — Execution records across projects — Eight-project Food ingredients manufacturer reconstruction
Historical/reference value · Historical run result
Active Targets · 166 Targets ↗
Applies to: Used deterministic collectors, normalizers, scorers, rankers, hashes, CRC, compilation, and tests
RESUME 5.0 v2.1.2 — Active targets — RESUME 5.0 v2.1.2
Historical/reference value · Historical run result
Raw Records · 206 Rows ↗
Applies to: Used deterministic collectors, normalizers, scorers, rankers, hashes, CRC, compilation, and tests
RESUME 5.0 v2.1.2 — Raw records — RESUME 5.0 v2.1.2
Historical/reference value · Historical run result
Normalized and Ranked Records · 203 Rows ↗
Applies to: Used deterministic collectors, normalizers, scorers, rankers, hashes, CRC, compilation, and tests
RESUME 5.0 v2.1.2 — Normalized and ranked records — RESUME 5.0 v2.1.2
Historical/reference value · Historical run result
User-Review Roles · 17 Roles ↗
Applies to: Used deterministic collectors, normalizers, scorers, rankers, hashes, CRC, compilation, and tests
RESUME 5.0 v2.1.2 — User-review roles — RESUME 5.0 v2.1.2
Historical/reference value · Historical run result
Priority Review Roles · 4 Roles ↗
Applies to: Used deterministic collectors, normalizers, scorers, rankers, hashes, CRC, compilation, and tests
RESUME 5.0 v2.1.2 — Priority review roles — RESUME 5.0 v2.1.2
Historical/reference value · Historical run result
Secondary Review Roles · 13 Roles ↗
Applies to: Used deterministic collectors, normalizers, scorers, rankers, hashes, CRC, compilation, and tests
RESUME 5.0 v2.1.2 — Secondary review roles — RESUME 5.0 v2.1.2
Historical/reference value · Historical run result
Tests Passed · 51 Tests ↗
Applies to: Used deterministic collectors, normalizers, scorers, rankers, hashes, CRC, compilation, and tests
RESUME 5.0 v2.1.2 — Tests passed — RESUME 5.0 v2.1.2
Historical/reference value · Historical run result
Tests Failed · 0 Tests ↗
Applies to: Used deterministic collectors, normalizers, scorers, rankers, hashes, CRC, compilation, and tests
RESUME 5.0 v2.1.2 — Tests failed — RESUME 5.0 v2.1.2
Historical/reference value · Historical run result
Active Targets · 166 Targets ↗
Applies to: Synthesized the later production-run record
RESUME 5.0 v2.2.0 — Active targets — RESUME 5.0 v2.2.0
Historical/reference value · Historical run result
Raw Records · 3,359 Rows ↗
Applies to: Synthesized the later production-run record
RESUME 5.0 v2.2.0 — Raw records — RESUME 5.0 v2.2.0
Historical/reference value · Historical run result
Normalized and Ranked Records · 2,058 Rows ↗
Applies to: Synthesized the later production-run record
RESUME 5.0 v2.2.0 — Normalized and ranked records — RESUME 5.0 v2.2.0
Historical/reference value · Historical run result
Candidates Scoring at Least 90 · 15 Candidates ↗
Applies to: Synthesized the later production-run record
RESUME 5.0 v2.2.0 — Candidates scoring at least 90 — RESUME 5.0 v2.2.0
Historical/reference value · Historical run result
Stretch Candidates · 245 Rows ↗
Applies to: Synthesized the later production-run record
RESUME 5.0 v2.2.0 — Stretch candidates — RESUME 5.0 v2.2.0
Historical/reference value · Historical run result
HTTP 429 Target Failures · 1 Failures ↗
Applies to: Synthesized the later production-run record
RESUME 5.0 v2.2.0 — HTTP 429 target failures — RESUME 5.0 v2.2.0
Scope or inventory quantity · Capstone validation output
Benchmark Exemplars · 4 Exemplars ↗
Applies to: Benchmarked the proposal against four exemplars
Selected bus-optimization scenarios — Benchmark exemplars — Selected bus-optimization scenarios
Scope or inventory quantity · Capstone validation output
Selected Scenarios · 3 Scenarios ↗
Applies to: Checked three selected 33-route by 34-period scenarios
Selected bus-optimization scenarios — Selected scenarios — Selected bus-optimization scenarios
Scope or inventory quantity · Capstone validation output
Routes per Scenario · 33 Routes ↗
Applies to: Checked three selected 33-route by 34-period scenarios
Selected bus-optimization scenarios — Routes per scenario — Selected bus-optimization scenarios
Scope or inventory quantity · Capstone validation output
Periods per Scenario · 34 Periods ↗
Applies to: Checked three selected 33-route by 34-period scenarios
Selected bus-optimization scenarios — Periods per scenario — Selected bus-optimization scenarios
Scope or inventory quantity · Capstone validation output
Rows per Scenario · 1,122 Rows ↗
Applies to: Checked three selected 33-route by 34-period scenarios
Selected bus-optimization scenarios — Rows per scenario — Selected bus-optimization scenarios
Scenario or model result · Capstone validation output
Recorded Consistency Mismatches · 0 Mismatches ↗
Applies to: Checked three selected 33-route by 34-period scenarios
Selected bus-optimization scenarios — Recorded consistency mismatches — Selected bus-optimization scenarios
Scope or inventory quantity · Capstone validation output
Visualization Records · 1,546 Records ↗
Applies to: Inventoried and audited visualization outputs
Selected bus-optimization scenarios — Visualization records — Selected bus-optimization scenarios
Scope or inventory quantity · Historical processing scope
Source Document Pages · 858 Pages ↗
Applies to: Directed AI-assisted parsing and synthesis of a consolidated portfolio into publication and capability mappings while maintaining separate employer and project financial layers
July 2026 portfolio processing — Source document pages — July 2026 portfolio processing
Scope or inventory quantity · Historical processing scope
Document Tables · 377 Tables ↗
Applies to: Directed AI-assisted parsing and synthesis of a consolidated portfolio into publication and capability mappings while maintaining separate employer and project financial layers
July 2026 portfolio processing — Document tables — July 2026 portfolio processing
Scope or inventory quantity · Historical processing scope
Text Nodes · 33,180 Nodes ↗
Applies to: Directed AI-assisted parsing and synthesis of a consolidated portfolio into publication and capability mappings while maintaining separate employer and project financial layers
July 2026 portfolio processing — Text nodes — July 2026 portfolio processing
Design parameter · Vendor laboratory test condition
Laboratory Test Temperature · 23 °C ↗
Applies to: Decanter supplier characterized the rice-wine sample, varied g-force and residence time, found decanter and sedicanter separation feasible, and recommended dynamic pilot testing at the required clarity and throughput
Decanter supplier rice-wine feasibility — Laboratory test temperature
Case: Rice Wine Decanter Trial
Observation · Vendor laboratory result
Total Solids · 85,217 Mg/L ↗
Applies to: Decanter supplier characterized the rice-wine sample, varied g-force and residence time, found decanter and sedicanter separation feasible, and recommended dynamic pilot testing at the required clarity and throughput
Decanter supplier rice-wine sample, 20 August 2024 — Total solids
Case: Rice Wine Decanter Trial
Observation · Vendor laboratory result
Suspended Solids · 30,767 Mg/L ↗
Applies to: Decanter supplier characterized the rice-wine sample, varied g-force and residence time, found decanter and sedicanter separation feasible, and recommended dynamic pilot testing at the required clarity and throughput
Decanter supplier rice-wine sample, 20 August 2024 — Suspended solids
Case: Rice Wine Decanter Trial
Observation · Vendor laboratory result
Dissolved Solids · 54,450 Mg/L ↗
Applies to: Decanter supplier characterized the rice-wine sample, varied g-force and residence time, found decanter and sedicanter separation feasible, and recommended dynamic pilot testing at the required clarity and throughput
Decanter supplier rice-wine sample, 20 August 2024 — Dissolved solids
Case: Rice Wine Decanter Trial
Observation · Vendor laboratory result
Particle-Size Median · 263.35049 µM ↗
Applies to: Decanter supplier characterized the rice-wine sample, varied g-force and residence time, found decanter and sedicanter separation feasible, and recommended dynamic pilot testing at the required clarity and throughput
Laboratory-instrument supplier LA-960 analysis of rice-wine feed — Printed median 263.35049 µm; the same D50 statistic is printed 263.3505 µm in the cumulative table, so it is retained as one observation.
Case: Rice Wine Decanter Trial
Observation · Vendor laboratory result
Particle-Size Mean · 343.91736 µM ↗
Applies to: Decanter supplier characterized the rice-wine sample, varied g-force and residence time, found decanter and sedicanter separation feasible, and recommended dynamic pilot testing at the required clarity and throughput
Laboratory-instrument supplier LA-960 analysis of rice-wine feed — Particle-size mean read from the embedded analyzer image; median/D50 retain their printed precision
Case: Rice Wine Decanter Trial
Observation · Vendor laboratory result
Particle-Size Mode · 482.8425 µM ↗
Applies to: Decanter supplier characterized the rice-wine sample, varied g-force and residence time, found decanter and sedicanter separation feasible, and recommended dynamic pilot testing at the required clarity and throughput
Laboratory-instrument supplier LA-960 analysis of rice-wine feed — Particle-size mode read from the embedded analyzer image; median/D50 retain their printed precision
Case: Rice Wine Decanter Trial
Observation · Vendor laboratory result
Particle Diameter at 10% Cumulative · 6.6742 µM ↗
Applies to: Decanter supplier characterized the rice-wine sample, varied g-force and residence time, found decanter and sedicanter separation feasible, and recommended dynamic pilot testing at the required clarity and throughput
Laboratory-instrument supplier LA-960 analysis of rice-wine feed — Particle diameter at 10% cumulative read from the embedded analyzer image; median/D50 retain their printed precision
Case: Rice Wine Decanter Trial
Observation · Vendor laboratory result
Particle Diameter at 90% Cumulative · 803.8865 µM ↗
Applies to: Decanter supplier characterized the rice-wine sample, varied g-force and residence time, found decanter and sedicanter separation feasible, and recommended dynamic pilot testing at the required clarity and throughput
Laboratory-instrument supplier LA-960 analysis of rice-wine feed — Particle diameter at 90% cumulative read from the embedded analyzer image; median/D50 retain their printed precision
Case: Rice Wine Decanter Trial
Observation · Vendor laboratory result
Analyzer Transmittance R · 91.9 % ↗
Applies to: Decanter supplier characterized the rice-wine sample, varied g-force and residence time, found decanter and sedicanter separation feasible, and recommended dynamic pilot testing at the required clarity and throughput
Laboratory-instrument supplier LA-960 analysis of rice-wine feed — Analyzer transmittance R
Case: Rice Wine Decanter Trial
Observation · Vendor laboratory result
Analyzer Transmittance B · 92.3 % ↗
Applies to: Decanter supplier characterized the rice-wine sample, varied g-force and residence time, found decanter and sedicanter separation feasible, and recommended dynamic pilot testing at the required clarity and throughput
Laboratory-instrument supplier LA-960 analysis of rice-wine feed — Analyzer transmittance B
Case: Rice Wine Decanter Trial
Observation · Vendor laboratory result
Cumulative Particle Distribution · 73.166 % ↗
Applies to: Decanter supplier characterized the rice-wine sample, varied g-force and residence time, found decanter and sedicanter separation feasible, and recommended dynamic pilot testing at the required clarity and throughput
Undersize at 500 µm — Printed cumulative undersize at 500 µm
Case: Rice Wine Decanter Trial
Observation · Vendor laboratory result
Cumulative Particle Distribution · 29.487 % ↗
Applies to: Decanter supplier characterized the rice-wine sample, varied g-force and residence time, found decanter and sedicanter separation feasible, and recommended dynamic pilot testing at the required clarity and throughput
Undersize at 100 µm — Printed cumulative undersize at 100 µm
Case: Rice Wine Decanter Trial
Observation · Vendor laboratory result
Cumulative Particle Distribution · 20.91 % ↗
Applies to: Decanter supplier characterized the rice-wine sample, varied g-force and residence time, found decanter and sedicanter separation feasible, and recommended dynamic pilot testing at the required clarity and throughput
Undersize at 50 µm — Printed cumulative undersize at 50 µm
Case: Rice Wine Decanter Trial
Observation · Vendor laboratory result
Cumulative Particle Distribution · 17.838 % ↗
Applies to: Decanter supplier characterized the rice-wine sample, varied g-force and residence time, found decanter and sedicanter separation feasible, and recommended dynamic pilot testing at the required clarity and throughput
Undersize at 20 µm — Printed cumulative undersize at 20 µm
Case: Rice Wine Decanter Trial
Observation · Vendor laboratory result
Cumulative Particle Distribution · 15.266 % ↗
Applies to: Decanter supplier characterized the rice-wine sample, varied g-force and residence time, found decanter and sedicanter separation feasible, and recommended dynamic pilot testing at the required clarity and throughput
Undersize at 10 µm — Printed cumulative undersize at 10 µm
Case: Rice Wine Decanter Trial
Observation · Vendor laboratory result
Cumulative Particle Distribution · 5.111 % ↗
Applies to: Decanter supplier characterized the rice-wine sample, varied g-force and residence time, found decanter and sedicanter separation feasible, and recommended dynamic pilot testing at the required clarity and throughput
Undersize at 5 µm — Printed cumulative undersize at 5 µm
Case: Rice Wine Decanter Trial
Observation · Vendor laboratory result
Cumulative Particle Distribution · 0 % ↗
Applies to: Decanter supplier characterized the rice-wine sample, varied g-force and residence time, found decanter and sedicanter separation feasible, and recommended dynamic pilot testing at the required clarity and throughput
Undersize at 1 µm — Printed cumulative undersize at 1 µm
Case: Rice Wine Decanter Trial
Observation · Vendor laboratory result
Cumulative Particle Distribution · 0 % ↗
Applies to: Decanter supplier characterized the rice-wine sample, varied g-force and residence time, found decanter and sedicanter separation feasible, and recommended dynamic pilot testing at the required clarity and throughput
Undersize at 0.5 µm — Printed cumulative undersize at 0.5 µm
Case: Rice Wine Decanter Trial
Observation · Vendor laboratory result
Cumulative Particle Distribution · 0 % ↗
Applies to: Decanter supplier characterized the rice-wine sample, varied g-force and residence time, found decanter and sedicanter separation feasible, and recommended dynamic pilot testing at the required clarity and throughput
Undersize at 0.2 µm — Printed cumulative undersize at 0.2 µm
Case: Rice Wine Decanter Trial
Design parameter · Vendor laboratory test condition
Test Centrifugal Acceleration · 1,000 g ↗
Applies to: Decanter supplier characterized the rice-wine sample, varied g-force and residence time, found decanter and sedicanter separation feasible, and recommended dynamic pilot testing at the required clarity and throughput
Photographed spin condition 1 — Test centrifugal acceleration
Case: Rice Wine Decanter Trial
Design parameter · Vendor laboratory test condition
Test Residence Time · 1 Min ↗
Applies to: Decanter supplier characterized the rice-wine sample, varied g-force and residence time, found decanter and sedicanter separation feasible, and recommended dynamic pilot testing at the required clarity and throughput
Photographed spin condition 1 — Test residence time
Case: Rice Wine Decanter Trial
Design parameter · Vendor laboratory test condition
Test Centrifugal Acceleration · 1,000 g ↗
Applies to: Decanter supplier characterized the rice-wine sample, varied g-force and residence time, found decanter and sedicanter separation feasible, and recommended dynamic pilot testing at the required clarity and throughput
Photographed spin condition 2 — Test centrifugal acceleration
Case: Rice Wine Decanter Trial
Design parameter · Vendor laboratory test condition
Test Residence Time · 5 Min ↗
Applies to: Decanter supplier characterized the rice-wine sample, varied g-force and residence time, found decanter and sedicanter separation feasible, and recommended dynamic pilot testing at the required clarity and throughput
Photographed spin condition 2 — Test residence time
Case: Rice Wine Decanter Trial
Design parameter · Vendor laboratory test condition
Test Centrifugal Acceleration · 3,000 g ↗
Applies to: Decanter supplier characterized the rice-wine sample, varied g-force and residence time, found decanter and sedicanter separation feasible, and recommended dynamic pilot testing at the required clarity and throughput
Photographed spin condition 3 — Test centrifugal acceleration
Case: Rice Wine Decanter Trial
Design parameter · Vendor laboratory test condition
Test Residence Time · 1 Min ↗
Applies to: Decanter supplier characterized the rice-wine sample, varied g-force and residence time, found decanter and sedicanter separation feasible, and recommended dynamic pilot testing at the required clarity and throughput
Photographed spin condition 3 — Test residence time
Case: Rice Wine Decanter Trial
Design parameter · Vendor laboratory test condition
Test Centrifugal Acceleration · 3,000 g ↗
Applies to: Decanter supplier characterized the rice-wine sample, varied g-force and residence time, found decanter and sedicanter separation feasible, and recommended dynamic pilot testing at the required clarity and throughput
Photographed spin condition 4 — Test centrifugal acceleration
Case: Rice Wine Decanter Trial
Design parameter · Vendor laboratory test condition
Test Residence Time · 2 Min ↗
Applies to: Decanter supplier characterized the rice-wine sample, varied g-force and residence time, found decanter and sedicanter separation feasible, and recommended dynamic pilot testing at the required clarity and throughput
Photographed spin condition 4 — Test residence time
Case: Rice Wine Decanter Trial
Design parameter · Vendor laboratory test condition
Test Centrifugal Acceleration · 3,000 g ↗
Applies to: Decanter supplier characterized the rice-wine sample, varied g-force and residence time, found decanter and sedicanter separation feasible, and recommended dynamic pilot testing at the required clarity and throughput
Photographed spin condition 5 — Test centrifugal acceleration
Case: Rice Wine Decanter Trial
Design parameter · Vendor laboratory test condition
Test Residence Time · 5 Min ↗
Applies to: Decanter supplier characterized the rice-wine sample, varied g-force and residence time, found decanter and sedicanter separation feasible, and recommended dynamic pilot testing at the required clarity and throughput
Photographed spin condition 5 — Test residence time
Case: Rice Wine Decanter Trial
Design parameter · Vendor laboratory test condition
Test Centrifugal Acceleration · 4,900 g ↗
Applies to: Decanter supplier characterized the rice-wine sample, varied g-force and residence time, found decanter and sedicanter separation feasible, and recommended dynamic pilot testing at the required clarity and throughput
Photographed spin condition 6 — Test centrifugal acceleration
Case: Rice Wine Decanter Trial
Design parameter · Vendor laboratory test condition
Test Residence Time · 5 Min ↗
Applies to: Decanter supplier characterized the rice-wine sample, varied g-force and residence time, found decanter and sedicanter separation feasible, and recommended dynamic pilot testing at the required clarity and throughput
Photographed spin condition 6 — Test residence time
Case: Rice Wine Decanter Trial
Design parameter · Vendor laboratory test condition
Test Centrifugal Acceleration · 6,500 g ↗
Applies to: Decanter supplier characterized the rice-wine sample, varied g-force and residence time, found decanter and sedicanter separation feasible, and recommended dynamic pilot testing at the required clarity and throughput
Photographed spin condition 7 — Test centrifugal acceleration
Case: Rice Wine Decanter Trial
Design parameter · Vendor laboratory test condition
Test Residence Time · 5 Min ↗
Applies to: Decanter supplier characterized the rice-wine sample, varied g-force and residence time, found decanter and sedicanter separation feasible, and recommended dynamic pilot testing at the required clarity and throughput
Photographed spin condition 7 — Test residence time
Case: Rice Wine Decanter Trial
Equipment rating · Vendor proposal
Scroll Speed · 1 to 10 rpm ↗
Applies to: Evaluated the C3E 4/454 proposal as a capital option, including the two-phase bowl and scroll, contact materials, wear protection, drives, controls, monitoring, optional feed/centrate integration and commercial schedule
Scroll drive — Scroll speed
Case: Rice Wine Decanter Trial
Equipment rating · Vendor proposal
Continuous Scroll Torque · 2,750 N M ↗
Applies to: Evaluated the C3E 4/454 proposal as a capital option, including the two-phase bowl and scroll, contact materials, wear protection, drives, controls, monitoring, optional feed/centrate integration and commercial schedule
Scroll reducer — Continuous scroll torque
Case: Rice Wine Decanter Trial
Estimate · Vendor-projected bowl-power reduction
Vendor Stated Bowl-Power Reduction · Approximately 20 % ↗
Applies to: Evaluated the C3E 4/454 proposal as a capital option, including the two-phase bowl and scroll, contact materials, wear protection, drives, controls, monitoring, optional feed/centrate integration and commercial schedule
Recuvane option — Decanter supplier proposal estimates approximately 20% bowl-motor power reduction for the Recuvane option; not a measured site energy saving.
Case: Rice Wine Decanter Trial
Equipment rating · Vendor proposal
Supply Phase Count · 3 Phases ↗
Applies to: Evaluated the C3E 4/454 proposal as a capital option, including the two-phase bowl and scroll, contact materials, wear protection, drives, controls, monitoring, optional feed/centrate integration and commercial schedule
Electrical supply — Supply phase count
Case: Rice Wine Decanter Trial
Equipment rating · Vendor proposal
Supply Frequency · 60 Hz ↗
Applies to: Evaluated the C3E 4/454 proposal as a capital option, including the two-phase bowl and scroll, contact materials, wear protection, drives, controls, monitoring, optional feed/centrate integration and commercial schedule
Electrical supply — Supply frequency
Case: Rice Wine Decanter Trial
Equipment rating · Vendor proposal
Supply Voltage · 480 V ↗
Applies to: Evaluated the C3E 4/454 proposal as a capital option, including the two-phase bowl and scroll, contact materials, wear protection, drives, controls, monitoring, optional feed/centrate integration and commercial schedule
Electrical supply — Supply voltage
Case: Rice Wine Decanter Trial
Equipment rating · Vendor proposal
Approximate Unit Weight · Approximately 3,900 lb ↗
Applies to: Evaluated the C3E 4/454 proposal as a capital option, including the two-phase bowl and scroll, contact materials, wear protection, drives, controls, monitoring, optional feed/centrate integration and commercial schedule
C3E option — Approximate unit weight
Case: Rice Wine Decanter Trial
Estimate · Vendor proposal
Submittal Review Allowance · 2 Weeks ↗
Applies to: Evaluated the C3E 4/454 proposal as a capital option, including the two-phase bowl and scroll, contact materials, wear protection, drives, controls, monitoring, optional feed/centrate integration and commercial schedule
After engineering submittal — Submittal review allowance
Case: Rice Wine Decanter Trial
Equipment rating · Vendor proposal
Illustrated Centrate-Tank Capacity · 130 US Gal ↗
Applies to: Evaluated the C3E 4/454 proposal as a capital option, including the two-phase bowl and scroll, contact materials, wear protection, drives, controls, monitoring, optional feed/centrate integration and commercial schedule
Z3E 4/454 arrangement drawing — Illustrated centrate-tank capacity
Case: Rice Wine Decanter Trial
Design parameter · Vendor test proposal
Proposed Concentrate Sample Volume · 500 ML ↗
Applies to: Coordinated and reviewed filtration supplier's laboratory cleanability study, using the vendor's neutralization, temperature and particulate findings to inform a production-validation decision
Proposed input — Proposed concentrate sample volume
Design parameter · Vendor test proposal
Proposed PES Membrane Pore Size · 0.2 µM ↗
Applies to: Coordinated and reviewed filtration supplier's laboratory cleanability study, using the vendor's neutralization, temperature and particulate findings to inform a production-validation decision
Proposed laboratory filtration — Proposed PES membrane pore size
Target · Vendor test proposal
Proposed Neutralization Endpoint · 7 pH Units ↗
Applies to: Coordinated and reviewed filtration supplier's laboratory cleanability study, using the vendor's neutralization, temperature and particulate findings to inform a production-validation decision
Proposed endpoint — Proposed neutralization endpoint
Design parameter · Vendor laboratory test condition
Initial Laboratory Temperature · 77 °F ↗
Applies to: Filtration supplier tested dilute sodium-hydroxide neutralization of residual acetic acid at laboratory scale; the study found no identified crystal-like particulate and recommended production validation
Before dosing — Reported 77°F ±1°F ambient/starting temperature
Observation · Vendor laboratory result
Laboratory Temperature After Dosing · 80 °F ↗
Applies to: Filtration supplier tested dilute sodium-hydroxide neutralization of residual acetic acid at laboratory scale; the study found no identified crystal-like particulate and recommended production validation
After first minute of dosing — Reported 80°F ±1°F; remained near this value for most dosing duration
Observation · Vendor laboratory result
Time to Reported Temperature Increase · 1 Min ↗
Applies to: Filtration supplier tested dilute sodium-hydroxide neutralization of residual acetic acid at laboratory scale; the study found no identified crystal-like particulate and recommended production validation
Neutralization — Time to reported temperature increase
Observation · Vendor laboratory result
pH · 3 to 4 pH Units ↗
Applies to: Filtration supplier tested dilute sodium-hydroxide neutralization of residual acetic acid at laboratory scale; the study found no identified crystal-like particulate and recommended production validation
Before neutralization — pH
Design parameter · Vendor laboratory method setting
SEM Image Magnification · 3,900 X ↗
Applies to: Filtration supplier tested dilute sodium-hydroxide neutralization of residual acetic acid at laboratory scale; the study found no identified crystal-like particulate and recommended production validation
membrane filter N66 NA disc examination — SEM image magnification
Target · Planned trial input
Active Pilot Testing · 3 Days ↗
Applies to: Rice Wine Decanter Trial
Planned active trial — Active pilot testing
Design parameter · Planned trial input
CIP Solution Batch Volume · Approximately 250 US Gal ↗
Applies to: Rice Wine Decanter Trial
Prepared in filter feed tank — CIP solution batch volume
Design parameter · Planned trial input
Initial Acid-Neutralizing CIP Volume · Approximately 50 US Gal ↗
Applies to: Rice Wine Decanter Trial
First flush portion — Initial acid-neutralizing CIP volume
Estimate · Planned trial input
Expected Remaining Spent-CIP pH · 11 to 12 pH Units ↗
Applies to: Rice Wine Decanter Trial
After initial acid neutralization — Expected remaining spent-CIP pH
Design parameter · Planned trial input
Pilot Stand Height · 40 in ↗
Applies to: Rice Wine Decanter Trial
Solids tote fit — Pilot stand height
Design parameter · Planned trial input
Planned Tote Top Removal · 10 in ↗
Applies to: Rice Wine Decanter Trial
Solids tote fit — Planned tote top removal
Equipment rating · Planned trial input
Solids-Capture Tote Capacity · 250 US Gal ↗
Applies to: Rice Wine Decanter Trial
Pilot waste handling — Solids-capture tote capacity
Equipment rating · Existing electrical circuit rating
Available Pilot Circuit Current · 60 A ↗
Applies to: Rice Wine Decanter Trial
Existing three-phase circuit — Available pilot circuit current
Estimate · Estimated option benefit
Estimated Relative Rebuild Interval · 4 to 5 X ↗
Applies to: Rice Wine Decanter Trial
Decanter versus separator comparison — Estimated relative rebuild interval
Estimate · Estimated option benefit
Potential Fermenter-Space Allowance · 2 to 3 Fermenters ↗
Applies to: Rice Wine Decanter Trial
Potential footprint benefit — Potential fermenter-space allowance
Estimate · Estimated option benefit
Expected CIP Operator Attention · Approximately 30 Min ↗
Applies to: Rice Wine Decanter Trial
Proposed decanter cleaning — Expected CIP operator attention
Target · Planned trial input
Planned Pilot Equipment Lead Time · 3 Weeks ↗
Applies to: Rice Wine Decanter Trial
After purchase order — Planned pilot equipment lead time
Target · Planned trial input
Planned Preinstallation Window · 2 Weeks ↗
Applies to: Rice Wine Decanter Trial
Overlapping equipment delivery — Planned preinstallation window
Target · Planned trial input
Planned Setup and Testing Window · 1 Weeks ↗
Applies to: Rice Wine Decanter Trial
Installation commissioning testing — Planned setup and testing window
Target · Planned trial input
Planned Overall Pilot Implementation · 3 to 4 Weeks ↗
Applies to: Rice Wine Decanter Trial
After purchase order — Planned overall pilot implementation
Target · Planned trial input
Minimum Pretest Onsite Availability · >= 2 Weeks ↗
Applies to: Rice Wine Decanter Trial
Before active trial — Minimum pretest onsite availability
Target · Planned trial input
Minimum Post-Test Onsite Availability · >= 2 Weeks ↗
Applies to: Rice Wine Decanter Trial
After active trial — Minimum post-test onsite availability
Observation · Sample specification
Sample Collection Temperature · 80 °F ↗
Applies to: Defined and submitted the unfiltered rice-wine sample and process basis to decanter supplier, including the recovery target for a feasibility study
14 August 2024 post-fermentation/pre-filtration — Sample collection temperature
Case: Rice Wine Decanter Trial
Target · Trial target
Recovery Target Priority · 1 Rank ↗
Applies to: Defined and submitted the unfiltered rice-wine sample and process basis to decanter supplier, including the recovery target for a feasibility study
Feasibility submission — Recovery target priority
Case: Rice Wine Decanter Trial
Design parameter · Design dimension
Outlet Basin Depth · 2 ft ↗
Applies to: Erosion Remediation and Rainwater Management
Depth of 10 by 15 by 2 foot outlet basin; distinct from 2 foot slab void depth.
Observation · Later trial observation
Brew 250 Later Throughput · 40 GPM ↗
Applies to: Winery Centrifuge Trial Prep and Utility Coordination
After nozzle correction — Brew 250 subsequently operated at 40 GPM near the established baseline; distinct from the earlier 20 GPM supplier-comparison limitation.
Historical/reference value · Reported post-change reference
Boiler Efficiency · 82.8 % ↗
Applies to: Boiler System Overhaul and Steam / Condensate Optimization
Heat-recovery comparison — Reported 82.8% post-change efficiency in the heat-recovery comparison, paired with the 79.8% baseline.
Target · Commitment
Fuel-Savings Commitment · 1.135 MMBtu/H ↗
Applies to: Boiler System Overhaul and Steam / Condensate Optimization
Recorded 1.135 MMBtu/h fuel-savings commitment; distinct from the 0.5 MMBtu/h modeled value.
Scenario or model result · Modeled benefit
Modeled Fuel Savings · 0.5 MMBtu/H ↗
Applies to: Boiler System Overhaul and Steam / Condensate Optimization
Modeled 0.5 MMBtu/h fuel savings; not interchangeable with the separate 1.135 MMBtu/h commitment.
Baseline · Before heat recovery
Flue Gas Temperature · 398 DegF ↗
Applies to: Boiler System Overhaul and Steam / Condensate Optimization
Baseline — Flue gas temperature before heat recovery.
Historical/reference value · Reported post-change reference
Flue Gas Temperature · 285 DegF ↗
Applies to: Boiler System Overhaul and Steam / Condensate Optimization
Heat-recovery comparison — Reported 285 degF post-change flue-gas temperature in the heat-recovery comparison, paired with the 398 degF baseline.
Observation · Readiness snapshot
Installation Readiness Before Equipment Receipt · 80 % ↗
Applies to: Fiberoptic OT Network Phase 1 and Phase 2, Configuration and Cutover Execution
Before final equipment receipt — Installation readiness before equipment receipt
Estimate · Demand forecast
Bottling Electrical Demand Forecast · 1,080 A ↗
Applies to: 480V Electrical Infrastructure Modernization and Phased 1000A-to-2000A Service Strategy
2030 — Bottling electrical demand forecast
Estimate · Demand forecast
Packaging Electrical Demand Forecast · 920 A ↗
Applies to: 480V Electrical Infrastructure Modernization and Phased 1000A-to-2000A Service Strategy
2040 — Packaging electrical demand forecast
Scenario or model result · Design-check alternative
Alternative Rainfall Check · 3.5 in/H ↗
Applies to: Drainage, weir and debris-screen design details
Alternative 3.5 inch/hour scenario; does not replace the 6 inch/hour design basis.
Scenario or model result · Design-check alternative
Alternative Runoff Check · 318.7 GPM ↗
Applies to: Drainage, weir and debris-screen design details
318.7 GPM alternative check; does not replace 545 GPM design flow.
Target · Design velocity target
Target Channel Velocity · 5 to 7 ft/S ↗
Applies to: Drainage, weir and debris-screen design details
Target Channel Velocity
Baseline · Planning constraint
Onsite Warehouse Capacity · 10 to 12 Days ↗
Applies to: Five-Year Capital Planning and Asset Lifecycle Roadmap
Onsite Warehouse Capacity
Scenario or model result · Forecast variance
Forecast Variance to Budget · 256,000 USD ↗
Applies to: Fermentation Extract Manufacturing Commercialization
Portfolio project register — Budget less estimate at completion; distinct from the difference between budget and final actual cost.
Scenario or model result · Forecast variance
Forecast Variance to Budget · 84,000 USD ↗
Applies to: Processed Meat and Seafood Soluble RBE Application Platform
Portfolio project register — Budget less estimate at completion; distinct from the difference between budget and final actual cost.
Scenario or model result · Forecast variance
Forecast Variance to Budget · 62,000 USD ↗
Applies to: Rice Bran Extract Meat-Analogue Platform Extension
Portfolio project register — Budget less estimate at completion; distinct from the difference between budget and final actual cost.
Scenario or model result · Forecast variance
Forecast Variance to Budget · 368,000 USD ↗
Applies to: Continuous Fermentation Natural Curing-Agent Process
Portfolio project register — Budget less estimate at completion; distinct from the difference between budget and final actual cost.
Scenario or model result · Forecast variance
Forecast Variance to Budget · 52,000 USD ↗
Applies to: Manufacturing Scheduling and MOM/MES Evaluation
Portfolio project register — Budget less estimate at completion; distinct from the difference between budget and final actual cost.
Scenario or model result · Forecast variance
Forecast Variance to Budget · 138,000 USD ↗
Applies to: Sustainable Water Treatment, Heat Recovery, and Wastewater Reuse
Portfolio project register — Budget less estimate at completion; distinct from the difference between budget and final actual cost.
Scenario or model result · Forecast variance
Forecast Variance to Budget · 194,000 USD ↗
Applies to: 480 V Electrical Service and Power-Quality Modernization
Portfolio project register — Budget less estimate at completion; distinct from the difference between budget and final actual cost.
Scenario or model result · Forecast variance
Forecast Variance to Budget · 18,000 USD ↗
Applies to: Ammonia/Glycol Refrigeration Safety, Compliance, and Mechanical-Integrity Retrofit
Portfolio project register — Budget less estimate at completion; distinct from the difference between budget and final actual cost.
Estimate · Planning estimate
Pre-Project Charge Estimate · 11,600 lb NH3 ↗
Applies to: Ammonia/Glycol Refrigeration Safety, Compliance, and Mechanical-Integrity Retrofit
Before field verification — Pre-project undocumented planning estimate
Baseline · Field-verified calculation
Field-Verified Installed Charge · 10,800 lb NH3 ↗
Applies to: Ammonia/Glycol Refrigeration Safety, Compliance, and Mechanical-Integrity Retrofit
Before Phase1–6 corrections — Field-verified calculated installed charge
Observation · Recorded condition
Charge After Dead-Leg and Isolation Corrections · 10,152 lb NH3 ↗
Applies to: Ammonia/Glycol Refrigeration Safety, Compliance, and Mechanical-Integrity Retrofit
After Phase1–6 corrections — Documented charge after Phase 1-6 dead-leg/isolation corrections
Actual result · Achieved reduction
Charge Reduction Through Dead-Leg and Isolation Corrections · 648 lb NH3 ↗
Applies to: Ammonia/Glycol Refrigeration Safety, Compliance, and Mechanical-Integrity Retrofit
Phase1–6 — Charge reduction achieved through Phase 1-6 corrections
Scenario or model result · Potential reduction
Candidate Charge Reduction from Full Glycol-Conversion Option · 2,400 lb NH3 ↗
Applies to: Ammonia/Glycol Refrigeration Safety, Compliance, and Mechanical-Integrity Retrofit
Full Phase7 option — Full Phase 7 candidate reduction if later executed
Scenario or model result · Potential future charge
Potential Final Charge After Full Phase7 Execution · 7,752 lb NH3 ↗
Applies to: Ammonia/Glycol Refrigeration Safety, Compliance, and Mechanical-Integrity Retrofit
Full Phase7 option — Potential final charge after full Phase 7 execution
Scope or inventory quantity · Field quantity basis
Refrigeration P&ID Sheets Issued or Revised · 12 Count ↗
Applies to: Ammonia/Glycol Refrigeration Safety, Compliance, and Mechanical-Integrity Retrofit
Refrigeration retrofit scope — Refrigeration P&ID sheets issued or revised
Scope or inventory quantity · Field quantity basis
P&ID Verification Items · 250 Count ↗
Applies to: Ammonia/Glycol Refrigeration Safety, Compliance, and Mechanical-Integrity Retrofit
Refrigeration retrofit scope — P&ID verification items
Scope or inventory quantity · Field quantity basis
Equipment Register Entries · 42 Count ↗
Applies to: Ammonia/Glycol Refrigeration Safety, Compliance, and Mechanical-Integrity Retrofit
Refrigeration retrofit scope — Equipment register entries
Scope or inventory quantity · Field quantity basis
Vessel/Nameplate Records · 14 Count ↗
Applies to: Ammonia/Glycol Refrigeration Safety, Compliance, and Mechanical-Integrity Retrofit
Refrigeration retrofit scope — Vessel/nameplate records
Scope or inventory quantity · Field quantity basis
Valve and Tag List Entries · 200 Count ↗
Applies to: Ammonia/Glycol Refrigeration Safety, Compliance, and Mechanical-Integrity Retrofit
Refrigeration retrofit scope — Valve and tag list entries
Scope or inventory quantity · Field quantity basis
Relief and Hydrostatic Relief Devices · 40 Count ↗
Applies to: Ammonia/Glycol Refrigeration Safety, Compliance, and Mechanical-Integrity Retrofit
Refrigeration retrofit scope — Relief and hydrostatic relief devices
Scope or inventory quantity · Field quantity basis
Ammonia Detectors · 9 Count ↗
Applies to: Ammonia/Glycol Refrigeration Safety, Compliance, and Mechanical-Integrity Retrofit
Refrigeration retrofit scope — Ammonia detectors
Scope or inventory quantity · Field quantity basis
Horn/Strobe/Alarm Devices · 11 Count ↗
Applies to: Ammonia/Glycol Refrigeration Safety, Compliance, and Mechanical-Integrity Retrofit
Refrigeration retrofit scope — Horn/strobe/alarm devices
Scope or inventory quantity · Field quantity basis
Emergency Ventilation and Shutdown Switches · 4 Count ↗
Applies to: Ammonia/Glycol Refrigeration Safety, Compliance, and Mechanical-Integrity Retrofit
Refrigeration retrofit scope — Emergency ventilation and shutdown switches
Scope or inventory quantity · Field quantity basis
Critical Valve Maps · 7 Count ↗
Applies to: Ammonia/Glycol Refrigeration Safety, Compliance, and Mechanical-Integrity Retrofit
Refrigeration retrofit scope — Critical valve maps
Scope or inventory quantity · Field quantity basis
Pipe Labels, Flow Arrows, Equipment Tags, Warning Signs · 320 Count ↗
Applies to: Ammonia/Glycol Refrigeration Safety, Compliance, and Mechanical-Integrity Retrofit
Refrigeration retrofit scope — Pipe labels, flow arrows, equipment tags, warning signs
Scope or inventory quantity · Field quantity basis
Mechanical-Integrity Findings · 80 Count ↗
Applies to: Ammonia/Glycol Refrigeration Safety, Compliance, and Mechanical-Integrity Retrofit
Refrigeration retrofit scope — Mechanical-integrity findings
Scope or inventory quantity · Field quantity basis
Condenser/Access/Guarding Findings · 18 Count ↗
Applies to: Ammonia/Glycol Refrigeration Safety, Compliance, and Mechanical-Integrity Retrofit
Refrigeration retrofit scope — Condenser/access/guarding findings
Scope or inventory quantity · Field quantity basis
Updated PM Tasks · 50 Count ↗
Applies to: Ammonia/Glycol Refrigeration Safety, Compliance, and Mechanical-Integrity Retrofit
Refrigeration retrofit scope — Updated PM tasks
Scope or inventory quantity · Field quantity basis
Controls I/O and Alarm Points Touched · 96 Count ↗
Applies to: Ammonia/Glycol Refrigeration Safety, Compliance, and Mechanical-Integrity Retrofit
Refrigeration retrofit scope — Controls I/O and alarm points touched
Scope or inventory quantity · Field quantity basis
Cause-and-Effect / Alarm-Response Test Paths · 50 Count ↗
Applies to: Ammonia/Glycol Refrigeration Safety, Compliance, and Mechanical-Integrity Retrofit
Refrigeration retrofit scope — Cause-and-effect / alarm-response test paths
Scope or inventory quantity · Field quantity basis
MOC Records · 20 Count ↗
Applies to: Ammonia/Glycol Refrigeration Safety, Compliance, and Mechanical-Integrity Retrofit
Refrigeration retrofit scope — MOC records
Scope or inventory quantity · Field quantity basis
PSSR Records · 8 Count ↗
Applies to: Ammonia/Glycol Refrigeration Safety, Compliance, and Mechanical-Integrity Retrofit
Refrigeration retrofit scope — PSSR records
Scope or inventory quantity · Field quantity basis
Personnel Requiring Training · 40 Count ↗
Applies to: Ammonia/Glycol Refrigeration Safety, Compliance, and Mechanical-Integrity Retrofit
Refrigeration retrofit scope — Personnel requiring training
Scenario or model result · Annual benefit component
Reduced Unplanned Refrigeration Interruptions · 78,000 USD/Year ↗
Applies to: Ammonia/Glycol Refrigeration Safety, Compliance, and Mechanical-Integrity Retrofit
Annualized benefit calculation — 12 avoided hours ×6,500USD/hour
Scenario or model result · Annualized benefit calculation input
Reduced Unplanned Refrigeration Interruptions — Quantity · 12 Avoided Hours/Year ↗
Applies to: Ammonia/Glycol Refrigeration Safety, Compliance, and Mechanical-Integrity Retrofit
Annualized benefit calculation — 12 avoided hours ×6,500USD/hour
Scenario or model result · Benefit calculation input
Reduced Unplanned Refrigeration Interruptions — Unit Rate · 6,500 USD/Hour ↗
Applies to: Ammonia/Glycol Refrigeration Safety, Compliance, and Mechanical-Integrity Retrofit
Annualized benefit calculation — 12 avoided hours ×6,500USD/hour
Scenario or model result · Annual benefit component
Avoided Emergency Contractor Call-Outs · 34,000 USD/Year ↗
Applies to: Ammonia/Glycol Refrigeration Safety, Compliance, and Mechanical-Integrity Retrofit
Annualized benefit calculation — 8 avoided call-outs ×4,250USD/call-out
Scenario or model result · Annualized benefit calculation input
Avoided Emergency Contractor Call-Outs — Quantity · 8 Avoided Call-Outs/Year ↗
Applies to: Ammonia/Glycol Refrigeration Safety, Compliance, and Mechanical-Integrity Retrofit
Annualized benefit calculation — 8 avoided call-outs ×4,250USD/call-out
Scenario or model result · Benefit calculation input
Avoided Emergency Contractor Call-Outs — Unit Rate · 4,250 USD/Call-Out ↗
Applies to: Ammonia/Glycol Refrigeration Safety, Compliance, and Mechanical-Integrity Retrofit
Annualized benefit calculation — 8 avoided call-outs ×4,250USD/call-out
Scenario or model result · Annual benefit component
Reduced PM and Troubleshooting Labor · 16,900 USD/Year ↗
Applies to: Ammonia/Glycol Refrigeration Safety, Compliance, and Mechanical-Integrity Retrofit
Annualized benefit calculation — 260hours ×65USD/hour
Scenario or model result · Annualized benefit calculation input
Reduced PM and Troubleshooting Labor — Quantity · 260 Hours/Year ↗
Applies to: Ammonia/Glycol Refrigeration Safety, Compliance, and Mechanical-Integrity Retrofit
Annualized benefit calculation — 260hours ×65USD/hour
Scenario or model result · Benefit calculation input
Reduced PM and Troubleshooting Labor — Unit Rate · 65 USD/Hour ↗
Applies to: Ammonia/Glycol Refrigeration Safety, Compliance, and Mechanical-Integrity Retrofit
Annualized benefit calculation — 260hours ×65USD/hour
Estimate · Planning reserve component
Insurance/Loss-Control/Compliance Reserve Reduction · 35,000 USD/Year ↗
Applies to: Ammonia/Glycol Refrigeration Safety, Compliance, and Mechanical-Integrity Retrofit
Annualized benefit calculation — $35,000/year fixed planning value for insurance, loss-control and compliance reserve reduction within the recorded $178,000 annual avoided-cost calculation.
Scenario or model result · Annual benefit component
Reduced Refrigerant Loss and Handling · 14,100 USD/Year ↗
Applies to: Ammonia/Glycol Refrigeration Safety, Compliance, and Mechanical-Integrity Retrofit
Annualized benefit calculation — 300lb ×47USD/lb
Scenario or model result · Annualized benefit calculation input
Reduced Refrigerant Loss and Handling — Quantity · 300 lb/Year ↗
Applies to: Ammonia/Glycol Refrigeration Safety, Compliance, and Mechanical-Integrity Retrofit
Annualized benefit calculation — 300lb ×47USD/lb
Scenario or model result · Benefit calculation input
Reduced Refrigerant Loss and Handling — Unit Rate · 47 USD/lb ↗
Applies to: Ammonia/Glycol Refrigeration Safety, Compliance, and Mechanical-Integrity Retrofit
Annualized benefit calculation — 300lb ×47USD/lb
Scenario or model result · Recorded annual avoided-cost calculation
Total Annual Avoided-Cost Benefit · 178,000 USD/Year ↗
Applies to: Ammonia/Glycol Refrigeration Safety, Compliance, and Mechanical-Integrity Retrofit
Annualized benefit calculation — Portfolio-recorded annual avoided-cost benefit of $178,000 combines $143,000 in interruption, contractor, labor and refrigerant benefit calculations with a $35,000 fixed planning reserve component. The portfolio describes the aggregate as actual benefit; the total therefore retains its mixed calculation and planning basis rather than representing $178,000 of realized cash savings.
Scenario or model result · Calculated payback
Simple Payback · 5.056179775280899 Years ↗
Applies to: Ammonia/Glycol Refrigeration Safety, Compliance, and Mechanical-Integrity Retrofit
Installed-cost basis divided by annual benefit — Calculated simple payback: $900,000 budgeted installed-cost basis divided by the $178,000/year avoided-cost calculation equals 450/89 years (about 5.056). The denominator includes the planning reserve component; this is not an observed payback period.
Scope or inventory quantity · Recorded process architecture
Process Steps · 9 Steps ↗
Applies to: Fermentation Extract Manufacturing Commercialization
RBE manufacturing train — Nine process steps are recorded in the project capability result.
Design parameter · Product-use specification
Maximum Intended Use · <= 1.5 % ↗
Applies to: Fermentation Extract Manufacturing Commercialization
GRN 884 basis — Maximum intended-use basis for the rice-bran extract; not a process yield.
Design parameter · Product composition context
Naturally Occurring Phosphate Content · 5 To 7 % ↗
Applies to: Fermentation Extract Manufacturing Commercialization
GRN 884 basis — Naturally occurring phosphates in the recorded product basis.
Scope or inventory quantity · Application scope
Application Classes · 5 Classes ↗
Applies to: Processed Meat and Seafood Soluble RBE Application Platform
Meat and seafood platform — Five application classes; retain the application-platform context.
Design parameter · Product composition context
Phosphorous Content Basis · 3 To 9 % ↗
Applies to: Processed Meat and Seafood Soluble RBE Application Platform
Meat and seafood application evidence — The source records a 3–9% phosphorous basis; no yield or savings inference.
Design parameter · Formulation specification
RBE Use Range · 0.1 To 4 % ↗
Applies to: Rice Bran Extract Meat-Analogue Platform Extension
Meat-analogue applications — Recorded application use range.
Design parameter · Preferred formulation
Preferred RBE Formulation Window · 1 To 2 % ↗
Applies to: Rice Bran Extract Meat-Analogue Platform Extension
Meat-analogue applications — Preferred formulation window within the recorded use range.
Design parameter · Trial condition
Pea and Soy Gel Trial Temperature · 85 °C ↗
Applies to: Rice Bran Extract Meat-Analogue Platform Extension
Pea and soy gel trials — Temperature in the recorded gel trials, not a universal process requirement.
Design parameter · Process design condition
Fermentation Temperature · 37 °C ↗
Applies to: Continuous Fermentation Natural Curing-Agent Process
Staphylococcus carnosus fermentation — Recorded fermentation temperature in the continuous natural-curing process.
Scope or inventory quantity · Operating scope
Part Variations · 78 Variations ↗
Applies to: Manufacturing Scheduling and MOM/MES Evaluation
MOM/MES scheduling environment — Recorded operating environment.
Scope or inventory quantity · Operating scope
Manufacturing Processes · 20 Processes ↗
Applies to: Manufacturing Scheduling and MOM/MES Evaluation
MOM/MES scheduling environment — Recorded operating environment.
Scope or inventory quantity · Operating scope
Customer Types · 3 Types ↗
Applies to: Manufacturing Scheduling and MOM/MES Evaluation
MOM/MES scheduling environment — Recorded operating environment.
Scope or inventory quantity · Vendor research scope
Suppliers Researched · > 40 Suppliers ↗
Applies to: Manufacturing Scheduling and MOM/MES Evaluation
MOM/MES solution research — More than 40 suppliers were researched.
Scope or inventory quantity · Vendor research scope
Suppliers Contacted · > 15 Suppliers ↗
Applies to: Manufacturing Scheduling and MOM/MES Evaluation
MOM/MES solution research — More than 15 suppliers were contacted.
Baseline · Recorded operating interval
Turnaround Duration · 4 to 8 Weeks ↗
Applies to: Manufacturing Scheduling and MOM/MES Evaluation
MOM/MES scheduling environment — Four-to-eight-week turnaround in the source operating environment.
Actual result · Recorded annual reduction
Biocide Reduction · 1,200 lb/Year ↗
Applies to: Sustainable Water Treatment, Heat Recovery, and Wastewater Reuse
Utility improvements — Recorded annual biocide reduction.
Actual result · Recorded annual reduction
Inhibitor Reduction · 2,400 Gal/Year ↗
Applies to: Sustainable Water Treatment, Heat Recovery, and Wastewater Reuse
Utility improvements — Recorded annual inhibitor reduction.
Actual result · Recorded annual benefit
Energy and Water Savings · 82,000 USD/Year ↗
Applies to: Sustainable Water Treatment, Heat Recovery, and Wastewater Reuse
Utility improvements — Combined recorded energy and water savings; do not assign the full amount to each component.
Actual result · Recorded annual reuse
Water Reuse · 300,000 Gal/Year ↗
Applies to: Sustainable Water Treatment, Heat Recovery, and Wastewater Reuse
Utility improvements — Annual reclaimed-water reuse, distinct from the monetary benefit.
Equipment rating · Installed rating
Electrical Service Current · 2,000 A ↗
Applies to: 480 V Electrical Service and Power-Quality Modernization
New electrical service — Installed, energized service rating.
Equipment rating · Installed rating
Electrical Service Voltage · 480 V ↗
Applies to: 480 V Electrical Service and Power-Quality Modernization
New electrical service — Installed service voltage.
Target · Planning horizon
Resilience Planning Horizon · 5 Years ↗
Applies to: 480 V Electrical Service and Power-Quality Modernization
Underground primary-distribution resilience plan — Strategic underground-primary framework; separate from the completed transformer deployment.
Actual result · Completed deployment quantity
Pad-Mounted Transformers Deployed · 9 Transformers ↗
Applies to: 480 V Electrical Service and Power-Quality Modernization
Electrical-service modernization — Nine deployed pad-mounted transformers with associated switchgear, grounding and distribution.
Equipment rating · Installed rating range
Transformer Rating · 2,500 to 3,750 kVA ↗
Applies to: 480 V Electrical Service and Power-Quality Modernization
Nine pad-mounted transformers — Individual transformer service-point ratings; do not sum both range endpoints or multiply a single selected rating across all nine.
Scope or inventory quantity · Utility interface quantity
Incoming Primary Feeder Sets · 2 Sets ↗
Applies to: 480 V Electrical Service and Power-Quality Modernization
Power-quality corrective coordination — Two incoming pole-fed primary feeder sets were the utility-coordination context.
Design parameter · Design dimension
Cage Length · 10 ft ↗
Applies to: CIP chemical-storage cage and sanitary piping
Chemical-cage scope
Design parameter · Design dimension
Cage Width · 16 ft ↗
Applies to: CIP chemical-storage cage and sanitary piping
Chemical-cage scope
Scope or inventory quantity · Design dimension
Gate Count · 2 Gates ↗
Applies to: CIP chemical-storage cage and sanitary piping
Chemical-cage scope
Design parameter · Design dimension
Gate Width · 8 ft ↗
Applies to: CIP chemical-storage cage and sanitary piping
Chemical-cage scope
Scope or inventory quantity · Scope quantity
Chemical Lines · 6 Lines ↗
Applies to: CIP chemical-storage cage and sanitary piping
Chemical-line scope
Scope or inventory quantity · Scope quantity
Shutoff Valves · 6 Valves ↗
Applies to: CIP chemical-storage cage and sanitary piping
Chemical-line scope
Scope or inventory quantity · Scope quantity
Removable Chemical Hoses · 6 Hoses ↗
Applies to: CIP chemical-storage cage and sanitary piping
Chemical-line scope
Design parameter · Design dimension
Chemical-Line Nominal Size · 1 in ↗
Applies to: CIP chemical-storage cage and sanitary piping
Chemical-line scope — One-inch lines are stated explicitly; the separate approximately200-foot source line contains a foot-mark typo and is not a second nominal size.
Design parameter · Approximate design quantity
Total Chemical-Line Length · Approximately 200 ft ↗
Applies to: CIP chemical-storage cage and sanitary piping
Chemical-line scope — Approximate total length across the six lines.
Design parameter · Layout dimension
Truck-and-Tote Footprint Width · 4 ft ↗
Applies to: CIP chemical-storage cage and sanitary piping
Location plan
Design parameter · Layout dimension
Truck-and-Tote Footprint Length · 12 ft ↗
Applies to: CIP chemical-storage cage and sanitary piping
Location plan
Design parameter · Approximate clearance
Installation-Clearance Width · 32 ft ↗
Applies to: CIP chemical-storage cage and sanitary piping
Location plan
Design parameter · Approximate clearance
Installation-Clearance Length · 32 ft ↗
Applies to: CIP chemical-storage cage and sanitary piping
Location plan
Estimate · Draft estimate rate
Stated Contingency Rate · 4 Percent ↗
Applies to: Line 1 Pasteurizer Repair Option Study
2025 repair AFE — The draft labels its allowance as 4%; component arithmetic is not silently recomputed.
Observation · Reported abnormal condition
Reported Overheating Temperature · > 300 Deg F ↗
Applies to: Line 1 Pasteurizer Repair
Reported Overheating Temperature
Design parameter · Specified equipment
Hot-Water Failover Valve Nominal Diameter · 1 in ↗
Applies to: Line 1 Pasteurizer Repair
2025 heat-control repair — Hot-water failover valve nominal diameter
Design parameter · Specified equipment
Overnight Steam Isolation Valve Nominal Diameter · 2 in ↗
Applies to: Line 1 Pasteurizer Repair
2025 heat-control repair — Overnight steam isolation valve nominal diameter
Design parameter · Specified equipment
Control Valve Nominal Diameter · 2 in ↗
Applies to: Line 1 Pasteurizer Repair
2025 heat-control repair — Control valve nominal diameter
Design parameter · Specified equipment
Existing Valve Remanufacture Nominal Diameter · 2 in ↗
Applies to: Line 1 Pasteurizer Repair
2025 heat-control repair — Existing valve remanufacture nominal diameter
Baseline · Existing condition
Existing PRV Inlet Diameter · 4 in ↗
Applies to: Reduction Steam Delivery Manifold Redesign and PRV Optimization
Existing PRV Inlet Diameter
Design parameter · Design question
Jacket Supply Line Diameter Under Evaluation · 3 in ↗
Applies to: Reduction Steam Delivery Manifold Redesign and PRV Optimization
Open steam-system engineering question before installation funding — Jacket supply line diameter under evaluation
Design parameter · Design question
Pressure Alternative Under Evaluation · > 10 psi ↗
Applies to: Reduction Steam Delivery Manifold Redesign and PRV Optimization
Open steam-system engineering question before installation funding — Pressure alternative under evaluation
Baseline · Condition history
Reported Valve and Pipe Erosion Exposure · 10 Year ↗
Applies to: Reduction Steam Delivery Manifold Redesign and PRV Optimization
Reported Valve and Pipe Erosion Exposure
Target · Conditional schedule
Schedule After Approval · 12 Week ↗
Applies to: Drumming pasteurizer design and procurement package (2015)
Schedule After Approval
Equipment rating · Existing equipment rating
Existing Boiler Rating · 40 Hp ↗
Applies to: Drumming pasteurizer design and procurement package (2015)
Existing Boiler Rating
Observation · Reported existing load
Existing Boiler Operating Load · 100 Percent ↗
Applies to: Drumming pasteurizer design and procurement package (2015)
Existing Boiler Operating Load
Baseline · Reported baseline
Existing Product Heat-Treatment Temperature · 135 Deg F ↗
Applies to: Drumming pasteurizer design and procurement package (2015)
Existing Product Heat-Treatment Temperature
Baseline · Reported baseline
Existing Full-Pasteurization Flow · 20 gpm ↗
Applies to: Drumming pasteurizer design and procurement package (2015)
Existing Full-Pasteurization Flow
Equipment rating · Proposed equipment rating
Proposed Boiler System Rating · 200 Hp ↗
Applies to: Drumming pasteurizer design and procurement package (2015)
Proposed Boiler System Rating
Design parameter · 2015 design value
Proposed Primary Product Flow · 110 gpm ↗
Applies to: Drumming pasteurizer design and procurement package (2015)
Proposed Primary Product Flow
Design parameter · 2015 design value
Proposed Pasteurization Product Temperature · 175 Deg F ↗
Applies to: Drumming pasteurizer design and procurement package (2015)
2015 design point; not a universal minimum in the historical product standard.
Design parameter · 2015 design value
Proposed Drumming Temperature After Recovery · 145 to 155 Deg F ↗
Applies to: Drumming pasteurizer design and procurement package (2015)
Proposed Drumming Temperature After Recovery
Scope or inventory quantity · Budget quantity
Budgeted UT35A Controller Quantity · 2 Count ↗
Applies to: Drumming pasteurizer design and procurement package (2015)
Budgeted UT35A Controller Quantity
Equipment rating · Alternative specified equipment
Primary Hot-Water Boiler Rating · 100 Hp ↗
Applies to: Drumming pasteurizer design and procurement package (2015)
Primary boiler supplier hot-water boiler
Equipment rating · Alternative specified equipment
Secondary Hot-Water Boiler Rating · 50 Hp ↗
Applies to: Drumming pasteurizer design and procurement package (2015)
Secondary boiler supplier hot-water boiler
Equipment rating · Alternative specified equipment
Sanitary Pump Specified Flow · 110 gpm ↗
Applies to: Drumming pasteurizer design and procurement package (2015)
Sanitary-pump supplier sanitary pump flow
Scope or inventory quantity · Alternative specified quantity
Alternative Stainless Exchanger Quantity · 2 Count ↗
Applies to: Drumming pasteurizer design and procurement package (2015)
Alternative Stainless Exchanger Quantity
Estimate · Alternative vendor schedule
Boiler Lead Time · 9 to 12 Week ↗
Applies to: Drumming pasteurizer design and procurement package (2015)
Boiler Lead Time
Estimate · Alternative vendor schedule
Exchanger Lead Time · 4 to 8 Week ↗
Applies to: Drumming pasteurizer design and procurement package (2015)
Exchanger Lead Time
Estimate · Alternative vendor schedule
Piping Installation Duration · 3 to 5 Day ↗
Applies to: Drumming pasteurizer design and procurement package (2015)
Piping Installation Duration
Quotation · Alternative commercial term
Initial Payment Fraction · 50 Percent ↗
Applies to: Drumming pasteurizer design and procurement package (2015)
Initial Payment Fraction
Quotation · Alternative commercial term
Delivery Payment Fraction · 30 Percent ↗
Applies to: Drumming pasteurizer design and procurement package (2015)
Delivery Payment Fraction
Quotation · Alternative commercial term
Remainder Payment Term · 20 Day ↗
Applies to: Drumming pasteurizer design and procurement package (2015)
Remainder Payment Term
Scope or inventory quantity · Preferred specified quantity
DynaFlame Unit Quantity · 2 Count ↗
Applies to: Drumming pasteurizer design and procurement package (2015)
DynaFlame Unit Quantity
Equipment rating · Preferred specified unit rating
DynaFlame Unit Input · 4,000 MBH ↗
Applies to: Drumming pasteurizer design and procurement package (2015)
DynaFlame Unit Input
Equipment rating · Preferred specified unit rating
DynaFlame Unit Output · 3,510 MBH ↗
Applies to: Drumming pasteurizer design and procurement package (2015)
DynaFlame Unit Output
Design parameter · 2015 design value
Heat-Transfer Supplier Design Product Flow · 110 gpm ↗
Applies to: Drumming pasteurizer design and procurement package (2015)
Heat-transfer equipment supplier design product flow
Design parameter · 2015 design value
Heat-Transfer Supplier Hot-Water Design Temperature · 200 Deg F ↗
Applies to: Drumming pasteurizer design and procurement package (2015)
Heat-transfer equipment supplier hot-water design temperature
Design parameter · 2015 design value
Heat-Transfer Supplier Leaving-Product Temperature · 175 Deg F ↗
Applies to: Drumming pasteurizer design and procurement package (2015)
Heat-transfer equipment supplier leaving-product temperature
Design parameter · 2015 design value
Preferred Hot-Water Pipe Nominal Diameter · 6 in ↗
Applies to: Drumming pasteurizer design and procurement package (2015)
Preferred Hot-Water Pipe Nominal Diameter
Design parameter · 2015 design value
Preferred Gas-Pipe Nominal Diameter as Written · 2 in ↗
Applies to: Drumming pasteurizer design and procurement package (2015)
Preferred Gas-Pipe Nominal Diameter as Written
Design parameter · 2015 design value
Preferred Proposal Electrical Voltage · 460 V ↗
Applies to: Drumming pasteurizer design and procurement package (2015)
2015 Installation contractor preferred proposal — Preferred proposal electrical voltage
Design parameter · 2015 design value
Preferred Proposal Electrical Frequency · 60 Hz ↗
Applies to: Drumming pasteurizer design and procurement package (2015)
2015 Installation contractor preferred proposal — Preferred proposal electrical frequency
Design parameter · 2015 design value
Preferred Proposal Electrical Phase Count · 3 Count ↗
Applies to: Drumming pasteurizer design and procurement package (2015)
2015 Installation contractor preferred proposal — Preferred proposal electrical phase count
Estimate · Preferred vendor schedule
Contractor Installation and Startup Duration · 3 to 5 Week ↗
Applies to: Drumming pasteurizer design and procurement package (2015)
Installation contractor installation/startup duration
Quotation · Preferred commercial term
Installation Contractor Initial Payment Fraction · 30 Percent ↗
Applies to: Drumming pasteurizer design and procurement package (2015)
Installation Contractor Initial Payment Fraction
Quotation · Preferred commercial term
Installation Contractor Remaining Payment Fraction · 70 Percent ↗
Applies to: Drumming pasteurizer design and procurement package (2015)
Installation Contractor Remaining Payment Fraction
Design parameter · 2015 design value
Hot-Side Flow · 470 gpm ↗
Applies to: Drumming pasteurizer design and procurement package (2015)
Exchanger design case 1 — Hot-side flow
Design parameter · 2015 design value
Product-Side Flow · 110 gpm ↗
Applies to: Drumming pasteurizer design and procurement package (2015)
Exchanger design case 1 — Product-side flow
Design parameter · 2015 design value
Hot-Side Inlet Temperature · 200 Deg F ↗
Applies to: Drumming pasteurizer design and procurement package (2015)
Exchanger design case 1 — Hot-side inlet temperature
Design parameter · 2015 design value
Hot-Side Outlet Temperature · 177.4 Deg F ↗
Applies to: Drumming pasteurizer design and procurement package (2015)
Exchanger design case 1 — Hot-side outlet temperature
Design parameter · 2015 design value
Product Inlet Temperature · 80 Deg F ↗
Applies to: Drumming pasteurizer design and procurement package (2015)
Exchanger design case 1 — Product inlet temperature
Design parameter · 2015 design value
Product Outlet Temperature · 175 Deg F ↗
Applies to: Drumming pasteurizer design and procurement package (2015)
Exchanger design case 1 — Product outlet temperature
Design parameter · 2015 design value
Exchanger Duty · 5,163.9 KBTU/H ↗
Applies to: Drumming pasteurizer design and procurement package (2015)
Exchanger design case 1 — Exchanger duty
Design parameter · 2015 design value
Hot-Side Flow · 235 gpm ↗
Applies to: Drumming pasteurizer design and procurement package (2015)
Exchanger design case 2 — Hot-side flow
Design parameter · 2015 design value
Product-Side Flow · 80 gpm ↗
Applies to: Drumming pasteurizer design and procurement package (2015)
Exchanger design case 2 — Product-side flow
Design parameter · 2015 design value
Hot-Side Inlet Temperature · 200 Deg F ↗
Applies to: Drumming pasteurizer design and procurement package (2015)
Exchanger design case 2 — Hot-side inlet temperature
Design parameter · 2015 design value
Hot-Side Outlet Temperature · 167.1 Deg F ↗
Applies to: Drumming pasteurizer design and procurement package (2015)
Exchanger design case 2 — Hot-side outlet temperature
Design parameter · 2015 design value
Product Inlet Temperature · 80 Deg F ↗
Applies to: Drumming pasteurizer design and procurement package (2015)
Exchanger design case 2 — Product inlet temperature
Design parameter · 2015 design value
Product Outlet Temperature · 175 Deg F ↗
Applies to: Drumming pasteurizer design and procurement package (2015)
Exchanger design case 2 — Product outlet temperature
Design parameter · 2015 design value
Exchanger Duty · 3,755.6 KBTU/H ↗
Applies to: Drumming pasteurizer design and procurement package (2015)
Exchanger design case 2 — Exchanger duty
Design parameter · 2015 design value
Exchanger Plate Count · 32 Count ↗
Applies to: Drumming pasteurizer design and procurement package (2015)
2015 vendor thermal design specification — Exchanger plate count
Design parameter · 2015 design value
Exchanger Plate Thickness · 0.4 mm ↗
Applies to: Drumming pasteurizer design and procurement package (2015)
2015 vendor thermal design specification — Exchanger plate thickness
Design parameter · 2015 design value
Exchanger Connection Nominal Diameter · 4 in ↗
Applies to: Drumming pasteurizer design and procurement package (2015)
2015 vendor thermal design specification — Exchanger connection nominal diameter
Design parameter · 2015 design value
Heat-Recovery Steam Temperature · 292 Deg F ↗
Applies to: Drumming pasteurizer design and procurement package (2015)
2015 vendor thermal design specification — Heat-recovery steam temperature
Design parameter · 2015 design value
Heat-Recovery Water Flow · 100 gpm ↗
Applies to: Drumming pasteurizer design and procurement package (2015)
2015 vendor thermal design specification — Heat-recovery water flow
Design parameter · 2015 design value
Heat-Recovery Water Inlet Temperature · 50 Deg F ↗
Applies to: Drumming pasteurizer design and procurement package (2015)
2015 vendor thermal design specification — Heat-recovery water inlet
Design parameter · 2015 design value
Heat-Recovery Water Outlet Temperature · 85 Deg F ↗
Applies to: Drumming pasteurizer design and procurement package (2015)
2015 vendor thermal design specification — Heat-recovery water outlet
Design parameter · 2015 design value
Heat-Recovery Steam Flow · 1,856.23 lb/H ↗
Applies to: Drumming pasteurizer design and procurement package (2015)
2015 vendor thermal design specification — Heat-recovery steam flow
Design parameter · 2015 design value
Heat-Recovery Exchanger Duty · 1,746,303 BTU/H ↗
Applies to: Drumming pasteurizer design and procurement package (2015)
2015 vendor thermal design specification — Heat-recovery exchanger duty
Design parameter · 2015 design value
Heat-Recovery Area · 16.51 ft2 ↗
Applies to: Drumming pasteurizer design and procurement package (2015)
2015 vendor thermal design specification — Heat-recovery area
Design parameter · 2015 design value
Heat-Recovery LMTD · 223.46 Deg F ↗
Applies to: Drumming pasteurizer design and procurement package (2015)
2015 vendor thermal design specification — Heat-recovery LMTD
Design parameter · 2015 design value
V48 Working Volume · 1,500 to 6,000 Gal ↗
Applies to: Drumming pasteurizer design and procurement package (2015)
Salted Porter product specification — V48 working volume
Design parameter · 2015 design value
Fermentation Temperature · 70 to 76 Deg F ↗
Applies to: Drumming pasteurizer design and procurement package (2015)
Salted Porter product specification — Fermentation temperature
Design parameter · 2015 design value
Brix Limit · < 3 Brix ↗
Applies to: Drumming pasteurizer design and procurement package (2015)
Salted Porter product specification — Brix limit
Design parameter · 2015 design value
Alcohol Specification · 6 to 9 Percent ↗
Applies to: Drumming pasteurizer design and procurement package (2015)
Salted Porter product specification — Alcohol specification
Design parameter · 2015 design value
Salt Specification · 1.5 to 1.7 Percent ↗
Applies to: Drumming pasteurizer design and procurement package (2015)
Salted Porter product specification — Salt specification
Design parameter · 2015 design value
Turbidity Limit · < 0.5 NTU ↗
Applies to: Drumming pasteurizer design and procurement package (2015)
Salted Porter product specification — Turbidity limit
Design parameter · 2015 design value
Filtration Rating · 0.45 Micrometer ↗
Applies to: Drumming pasteurizer design and procurement package (2015)
Salted Porter product specification — Filtration rating
Design parameter · 2015 design value
Pasteurization Temperature · 170 Deg F ↗
Applies to: Drumming pasteurizer design and procurement package (2015)
Salted Porter product specification — Pasteurization temperature
Design parameter · 2015 design value
Drum-Filling Temperature · 160 to 170 Deg F ↗
Applies to: Drumming pasteurizer design and procurement package (2015)
Salted Porter product specification — Drum-filling temperature
Design parameter · 2015 design value
Valve Nominal Diameter · 2 in ↗
Applies to: Drumming pasteurizer design and procurement package (2015)
valve nominal diameter
Equipment rating · 2015 design value
Actuator Supply Voltage · 115 VAC ↗
Applies to: Drumming pasteurizer design and procurement package (2015)
actuator supply
Design parameter · 2015 design value
Supplier-Specified Sanitary RTD Length · 5 in ↗
Applies to: Drumming pasteurizer design and procurement package (2015)
Instrumentation supplier sanitary RTD length
Design parameter · Vendor construction specification
Concrete Specified Strength · 4,000 psi ↗
Applies to: Drumming pasteurizer design and procurement package (2015)
Concrete Specified Strength
Equipment rating · Existing drawing label
Existing Heater Heat Input Label · 1,340,000 BTU/H ↗
Applies to: Drumming pasteurizer design and procurement package (2015)
Existing Heater Heat Input Label
Equipment rating · 2015 design value
Drawing Individual Heater Rating · 100 Hp ↗
Applies to: Drumming pasteurizer design and procurement package (2015)
2015 process proposal drawing — Drawing individual heater rating
Equipment rating · 2015 design value
Drawing Heater Voltage · 230 V ↗
Applies to: Drumming pasteurizer design and procurement package (2015)
2015 process proposal drawing — Drawing heater voltage
Equipment rating · 2015 design value
Drawing Heater Phase Count · 1 Count ↗
Applies to: Drumming pasteurizer design and procurement package (2015)
2015 process proposal drawing — Drawing heater phase count
Equipment rating · 2015 design value
Drawing Boiler Current per Unit · 20 A ↗
Applies to: Drumming pasteurizer design and procurement package (2015)
2015 process proposal drawing — Drawing boiler current per unit
Equipment rating · 2015 design value
Drawing Pump Current per Unit · 30 A ↗
Applies to: Drumming pasteurizer design and procurement package (2015)
2015 process proposal drawing — Drawing pump current per unit
Design parameter · 2015 design value
Supplier Drawing: Heat-Exchanger Connection Diameter · 2 in ↗
Applies to: Drumming pasteurizer design and procurement package (2015)
2015 process proposal drawing — Heat-exchanger supplier drawing connection diameter
Design parameter · 2015 design value
Proposed Pump Head · 160 ft ↗
Applies to: Drumming pasteurizer design and procurement package (2015)
2015 process proposal drawing — Proposed pump head
Design parameter · 2015 design value
Proposed Pump Flow · 110 gpm ↗
Applies to: Drumming pasteurizer design and procurement package (2015)
2015 process proposal drawing — Proposed pump flow
Design parameter · 2015 design value
Proposed Pump Impeller Diameter · 10.2 in ↗
Applies to: Drumming pasteurizer design and procurement package (2015)
2015 process proposal drawing — Proposed pump impeller diameter
Design parameter · 2015 design value
RTD Tri-Clamp Diameter · 2 in ↗
Applies to: Drumming pasteurizer design and procurement package (2015)
2015 process proposal drawing — RTD tri-clamp diameter
Design parameter · 2015 design value
RTD Probe Length · 4 in ↗
Applies to: Drumming pasteurizer design and procurement package (2015)
2015 process proposal drawing — RTD probe length
Design parameter · 2015 design value
Valve Nominal Diameter · 2 in ↗
Applies to: Drumming pasteurizer design and procurement package (2015)
2015 process proposal drawing — valve nominal diameter
Equipment rating · 2015 design value
Actuator Voltage · 120 VAC ↗
Applies to: Drumming pasteurizer design and procurement package (2015)
2015 process proposal drawing — actuator voltage
Design parameter · 2015 design value
WDV Inlet Temperature · 75 Deg F ↗
Applies to: Drumming pasteurizer design and procurement package (2015)
2015 process proposal drawing — WDV path — WDV inlet temperature
Design parameter · 2015 design value
WDV Preheat Temperature · 85 Deg F ↗
Applies to: Drumming pasteurizer design and procurement package (2015)
2015 process proposal drawing — WDV path — WDV preheat temperature
Design parameter · 2015 design value
WDV Primary Heated Temperature · 175 Deg F ↗
Applies to: Drumming pasteurizer design and procurement package (2015)
2015 process proposal drawing — WDV path — WDV primary heated temperature
Design parameter · 2015 design value
WDV Post-Recovery Temperature · 155 Deg F ↗
Applies to: Drumming pasteurizer design and procurement package (2015)
2015 process proposal drawing — WDV path — WDV post-recovery temperature
Design parameter · 2015 design value
Drawing Recirculation Temperature Trigger · < 150 Deg F ↗
Applies to: Drumming pasteurizer design and procurement package (2015)
2015 process proposal drawing — Drawing recirculation temperature trigger
Design parameter · 2015 design value
Layout Control-Panel Voltage · 110 VAC ↗
Applies to: Drumming pasteurizer design and procurement package (2015)
2015 proposed layout drawing — Layout control-panel voltage
Design parameter · 2015 design value
Layout Heater Voltage · 480 VAC ↗
Applies to: Drumming pasteurizer design and procurement package (2015)
2015 proposed layout drawing — Layout heater voltage
Design parameter · 2015 design value
Layout Heater Current · 60 A ↗
Applies to: Drumming pasteurizer design and procurement package (2015)
2015 proposed layout drawing — Layout heater current
Design parameter · 2015 design value
Layout Heater Phase Count · 1 Count ↗
Applies to: Drumming pasteurizer design and procurement package (2015)
2015 proposed layout drawing — Layout heater phase count
Baseline · Observed baseline
Boiler Internal Temperature Setpoint X1 · 190 Deg F ↗
Applies to: Drumming heat-recovery and throughput optimization study
Boiler internal setpoint X1
Baseline · Observed baseline
Boiler Outlet Temperature X2 · 173.2 Deg F ↗
Applies to: Drumming heat-recovery and throughput optimization study
Boiler outlet X2
Baseline · Observed baseline
Hot-Water Temperature Entering Exchanger T2 · 161.3 Deg F ↗
Applies to: Drumming heat-recovery and throughput optimization study
Hot water entering exchanger T2
Baseline · Observed baseline
Hot-Water Temperature Leaving Exchanger T1 · 160.5 Deg F ↗
Applies to: Drumming heat-recovery and throughput optimization study
Hot water leaving exchanger T1
Baseline · Observed baseline
Hot-Water Temperature Returning to Boiler X3 · 157.2 Deg F ↗
Applies to: Drumming heat-recovery and throughput optimization study
Hot water returning to boiler X3
Baseline · Observed baseline
Vinegar Temperature Entering Exchanger T3 · 91.3 Deg F ↗
Applies to: Drumming heat-recovery and throughput optimization study
Vinegar entering exchanger T3
Baseline · Observed baseline
Vinegar Temperature Exiting Exchanger T4 · 136.9 Deg F ↗
Applies to: Drumming heat-recovery and throughput optimization study
Vinegar exiting exchanger T4
Baseline · Observed baseline
Hot-Water Flow · 89 gpm ↗
Applies to: Drumming heat-recovery and throughput optimization study
Hot-Water Flow
Baseline · Observed baseline
Vinegar Flow · 22 gpm ↗
Applies to: Drumming heat-recovery and throughput optimization study
Vinegar Flow
Target · Study requirement
Required Vinegar Temperature · 130 to 140 Deg F ↗
Applies to: Drumming heat-recovery and throughput optimization study
Required Vinegar Temperature
Target · Proposed target
Page-One Restoration-Flow Objective · 55 gpm ↗
Applies to: Drumming heat-recovery and throughput optimization study
This page-one target is distinct from the later 44 gpm doubling scenario.
Scenario or model result · Calculation scenario
Doubling Calculation Flow Scenario · 44 gpm ↗
Applies to: Drumming heat-recovery and throughput optimization study
Doubling Calculation Flow Scenario
Baseline · Observed baseline
Uninsulated Pipe Nominal Diameter · 2 in ↗
Applies to: Drumming heat-recovery and throughput optimization study
Uninsulated Pipe Nominal Diameter
Baseline · Observed baseline
Uninsulated Pipe Length · 225 ft ↗
Applies to: Drumming heat-recovery and throughput optimization study
Uninsulated Pipe Length
Baseline · Reported historical baseline
Reported Historical Boiler-System Flow · 80 to 90 gpm ↗
Applies to: Drumming heat-recovery and throughput optimization study
Reported historical boiler supplier flow
Baseline · Reported historical baseline
Reported Historical Hot-Water Range · 140 to 160 Deg F ↗
Applies to: Drumming heat-recovery and throughput optimization study
Reported Historical Hot-Water Range
Historical/reference value · Reported project history
Reported Boiler-Relocation Elapsed Time · 1.5 Year ↗
Applies to: Drumming heat-recovery and throughput optimization study
Reported Boiler-Relocation Elapsed Time
Design parameter · Prior stated requirement
Prior Vinegar Temperature Range · 120 to 130 Deg F ↗
Applies to: Drumming heat-recovery and throughput optimization study
Prior Vinegar Temperature Range
Baseline · Reported baseline
Fill-Time Multiplier Versus Historical Average · 2.5 Ratio ↗
Applies to: Drumming heat-recovery and throughput optimization study
Fill-Time Multiplier Versus Historical Average
Target · Proposed target
Draft Upgrade Vinegar-Flow Objective · 44 gpm ↗
Applies to: Drumming heat-recovery and throughput optimization study
Draft Upgrade Vinegar-Flow Objective
Design parameter · Electrical vendor scope
Enclosure Width · 18 in ↗
Applies to: Drumming pasteurizer design and procurement package (2015)
2015 Electrical contractor electrical proposal — Enclosure width
Design parameter · Electrical vendor scope
Enclosure Height · 24 in ↗
Applies to: Drumming pasteurizer design and procurement package (2015)
2015 Electrical contractor electrical proposal — Enclosure height
Design parameter · Electrical vendor scope
Enclosure Depth · 10 in ↗
Applies to: Drumming pasteurizer design and procurement package (2015)
2015 Electrical contractor electrical proposal — Enclosure depth
Design parameter · Electrical vendor scope
Dedicated Controls Supply Voltage · 110 V ↗
Applies to: Drumming pasteurizer design and procurement package (2015)
2015 Electrical contractor electrical proposal — Dedicated controls power
Equipment rating · Electrical vendor scope
RTD Resistance Rating · 100 Ohm ↗
Applies to: Drumming pasteurizer design and procurement package (2015)
2015 Electrical contractor electrical proposal — RTD resistance rating
Design parameter · Electrical vendor scope
RTD Cable Conductor Count · 3 Count ↗
Applies to: Drumming pasteurizer design and procurement package (2015)
2015 Electrical contractor electrical proposal — RTD cable conductor count
Design parameter · Electrical vendor scope
Actuator Conductor Count · 2 Count ↗
Applies to: Drumming pasteurizer design and procurement package (2015)
2015 Electrical contractor electrical proposal — Actuator conductor count
Design parameter · Electrical vendor scope
New Boiler Circuit Rating · 60 A ↗
Applies to: Drumming pasteurizer design and procurement package (2015)
2015 Electrical contractor electrical proposal — New boiler circuit rating
Design parameter · Electrical vendor scope
New Boiler Circuit Voltage · 480 V ↗
Applies to: Drumming pasteurizer design and procurement package (2015)
2015 Electrical contractor electrical proposal — New boiler circuit voltage
Design parameter · Electrical vendor scope
New Boiler Circuit Phase Count · 3 Count ↗
Applies to: Drumming pasteurizer design and procurement package (2015)
2015 Electrical contractor electrical proposal — New boiler circuit phase count
Equipment rating · Electrical vendor scope
Pump Motor Rating · 10 Hp ↗
Applies to: Drumming pasteurizer design and procurement package (2015)
2015 Electrical contractor electrical proposal — Pump motor rating
Design parameter · Specified quantity
Process/CIP Hose Length · 150 ft ↗
Applies to: Winery Centrifuge Electrical Prep and Utility Coordination
Specified process/cip hose length.
Design parameter · Specified quantity
Process Hose Inside Diameter · 2 in ↗
Applies to: Winery Centrifuge Electrical Prep and Utility Coordination
Specified process hose inside diameter.
Design parameter · Specified quantity
Freshwater Hose Length, 1 in ID · 20 ft ↗
Applies to: Winery Centrifuge Electrical Prep and Utility Coordination
Specified freshwater hose length, 1 in id.
Design parameter · Specified quantity
Freshwater Hose Length, 5/8 in ID · 60 ft ↗
Applies to: Winery Centrifuge Electrical Prep and Utility Coordination
Specified freshwater hose length, 5/8 in id.
Design parameter · Specified quantity
Compressed-Air Hose Length · 25 ft ↗
Applies to: Winery Centrifuge Electrical Prep and Utility Coordination
Specified compressed-air hose length.
Design parameter · Design requirement
Positive Feed Requirement · 2 to 5 psi ↗
Applies to: Winery Centrifuge Electrical Prep and Utility Coordination
Required positive pressure from the feed tank to skid.
Design parameter · Design input
Racking-Valve Elevation · Approximately 60 in ↗
Applies to: Winery Centrifuge Electrical Prep and Utility Coordination
Approximate racking-valve elevation used for pump sizing.
Design parameter · Design input
Maximum Working Liquid Elevation · Approximately 220 in ↗
Applies to: Winery Centrifuge Electrical Prep and Utility Coordination
Approximate maximum working liquid elevation used for pump sizing.
Design parameter · Design input
Feed-Manifold Elevation · Approximately 12 in ↗
Applies to: Winery Centrifuge Electrical Prep and Utility Coordination
Approximate feed-manifold elevation used for pump sizing.
Design parameter · Design input
Feed-Manifold Diameter · Approximately 3 in ↗
Applies to: Winery Centrifuge Electrical Prep and Utility Coordination
Approximate feed-manifold diameter used for pump sizing.
Operating control · Supplier service estimate
Supplier Service Proposal A: Intermediate-Service Interval · 2,000 H ↗
Applies to: Centrifuge Supplier Evaluation and Manufacturing Maturity Scorecard
Vendor service proposal; intervals and travel-dependent costs are distinct from completed maintenance.
Operating control · Supplier service estimate
Supplier Service Proposal A: Intermediate-Service Calendar Interval · 3 Month ↗
Applies to: Centrifuge Supplier Evaluation and Manufacturing Maturity Scorecard
Vendor service proposal; intervals and travel-dependent costs are distinct from completed maintenance.
Operating control · Supplier service estimate
Supplier Service Proposal A: Major-Service Interval · 8,000 H ↗
Applies to: Centrifuge Supplier Evaluation and Manufacturing Maturity Scorecard
Vendor service proposal; intervals and travel-dependent costs are distinct from completed maintenance.
Operating control · Supplier service estimate
Supplier Service Proposal A: Major-Service Calendar Interval · 1 Year ↗
Applies to: Centrifuge Supplier Evaluation and Manufacturing Maturity Scorecard
Vendor service proposal; intervals and travel-dependent costs are distinct from completed maintenance.
Operating control · Supplier service estimate
Supplier Service Proposal B: Minor-Service Interval · 1,500 H ↗
Applies to: Centrifuge Supplier Evaluation and Manufacturing Maturity Scorecard
Meeting/quote service estimate; silicon-carbide seal cost and frequency were unresolved.
Operating control · Supplier service estimate
Supplier Service Proposal B: Major-Service Interval · 8,000 H ↗
Applies to: Centrifuge Supplier Evaluation and Manufacturing Maturity Scorecard
Meeting/quote service estimate; silicon-carbide seal cost and frequency were unresolved.
Operating control · Supplier service estimate
Supplier Service Proposal B: Oil-Change Interval · 750 H ↗
Applies to: Centrifuge Supplier Evaluation and Manufacturing Maturity Scorecard
Meeting/quote service estimate; silicon-carbide seal cost and frequency were unresolved.
Observation · Vendor training record
Oil-Change Procedure Duration · 10 Min ↗
Applies to: Centrifuge filtration recovery and equipment-relocation evaluation
Centrifuge supplier startup, 2024-10-22 — Centrifuge supplier reported demonstrating the ten-minute oil-change process during operator training at the startup.
Observation · Vendor trial observation
Flow · 30 GPM ↗
Applies to: Centrifuge filtration recovery and equipment-relocation evaluation
Centrifuge supplier trial, 22–23 October 2024 — Initial Apple Wine startup — Vendor-reported initial apple wine startup: flow.
Observation · Vendor trial observation
Outlet Backpressure · 150 psi ↗
Applies to: Centrifuge filtration recovery and equipment-relocation evaluation
Centrifuge supplier trial, 22–23 October 2024 — Initial Apple Wine startup — Vendor-reported initial apple wine startup: outlet backpressure.
Observation · Vendor trial observation
Flow · 30 GPM ↗
Applies to: Centrifuge filtration recovery and equipment-relocation evaluation
Centrifuge supplier trial, 22–23 October 2024 — After inline-to-lab scaling — Vendor-reported after inline-to-lab scaling: flow.
Observation · Vendor trial observation
Outlet Backpressure · 100 psi ↗
Applies to: Centrifuge filtration recovery and equipment-relocation evaluation
Centrifuge supplier trial, 22–23 October 2024 — After inline-to-lab scaling — Vendor-reported after inline-to-lab scaling: outlet backpressure.
Observation · Vendor trial observation
Outlet Turbidity · 17 NTU ↗
Applies to: Centrifuge filtration recovery and equipment-relocation evaluation
Centrifuge supplier trial, 22–23 October 2024 — After inline-to-lab scaling — Vendor-reported after inline-to-lab scaling: outlet turbidity.
Observation · Vendor trial observation
Flow · 40 GPM ↗
Applies to: Centrifuge filtration recovery and equipment-relocation evaluation
Centrifuge supplier trial, 22–23 October 2024 — Raised flow — Vendor-reported raised flow: flow.
Observation · Vendor trial observation
Outlet Backpressure · 100 psi ↗
Applies to: Centrifuge filtration recovery and equipment-relocation evaluation
Centrifuge supplier trial, 22–23 October 2024 — Raised flow — Vendor-reported raised flow: outlet backpressure.
Observation · Vendor trial observation
Outlet Turbidity · 20 NTU ↗
Applies to: Centrifuge filtration recovery and equipment-relocation evaluation
Centrifuge supplier trial, 22–23 October 2024 — Raised flow — Vendor-reported raised flow: outlet turbidity.
Observation · Vendor trial observation
Flow · 40 GPM ↗
Applies to: Centrifuge filtration recovery and equipment-relocation evaluation
Centrifuge supplier trial, 22–23 October 2024 — Reduced outlet backpressure — Vendor-reported reduced outlet backpressure: flow.
Observation · Vendor trial observation
Outlet Backpressure · 75 psi ↗
Applies to: Centrifuge filtration recovery and equipment-relocation evaluation
Centrifuge supplier trial, 22–23 October 2024 — Reduced outlet backpressure — Vendor-reported reduced outlet backpressure: outlet backpressure.
Observation · Vendor trial observation
Outlet Turbidity · 20 NTU ↗
Applies to: Centrifuge filtration recovery and equipment-relocation evaluation
Centrifuge supplier trial, 22–23 October 2024 — Reduced outlet backpressure — Vendor-reported reduced outlet backpressure: outlet turbidity.
Observation · Vendor trial observation
Flow · 50 GPM ↗
Applies to: Centrifuge filtration recovery and equipment-relocation evaluation
Centrifuge supplier trial, 22–23 October 2024 — Following-day repeated run — Vendor-reported following-day repeated run: flow.
Observation · Vendor trial observation
Outlet Backpressure · 100 psi ↗
Applies to: Centrifuge filtration recovery and equipment-relocation evaluation
Centrifuge supplier trial, 22–23 October 2024 — Following-day repeated run — Vendor-reported following-day repeated run: outlet backpressure.
Observation · Vendor trial observation
Outlet Turbidity · 23 NTU ↗
Applies to: Centrifuge filtration recovery and equipment-relocation evaluation
Centrifuge supplier trial, 22–23 October 2024 — Following-day repeated run — Vendor-reported following-day repeated run: outlet turbidity.
Observation · Vendor trial observation
Stable Production Duration · Approximately 5 H ↗
Applies to: Centrifuge filtration recovery and equipment-relocation evaluation
Centrifuge supplier trial, 22–23 October 2024 — Vendor reported approximately five hours without production issues at the stated settings after the air adjustment.
Observation · Vendor trial observation
Additional Air-Pressure Adjustment · 5 psi ↗
Applies to: Centrifuge filtration recovery and equipment-relocation evaluation
Centrifuge supplier trial, 22–23 October 2024 — Vendor increased supply air another 5 psi after a low-pressure alarm.
Observation · Vendor trial observation
Solids Discharge Interval · 4 to 5 Min ↗
Applies to: Centrifuge filtration recovery and equipment-relocation evaluation
Centrifuge supplier trial, 22–23 October 2024 — Vendor-reported discharge interval at 50 GPM; solids packing and post-rinse needs varied with flow.
Observation · Vendor trial observation
Solids Discharge Interval · 12 to 13 Min ↗
Applies to: Centrifuge filtration recovery and equipment-relocation evaluation
Centrifuge supplier trial, 22–23 October 2024 — Vendor-reported discharge interval at 40 GPM; solids packing and post-rinse needs varied with flow.
Operating control · Configured trial recipe
Automatic Recipe Flow · 50 GPM ↗
Applies to: Centrifuge filtration recovery and equipment-relocation evaluation
Centrifuge supplier trial, 22–23 October 2024 — Vendor-developed automatic recipe; 10 GPM was a slow overnight option with occasional checks recommended.
Operating control · Configured trial recipe
Automatic Recipe Flow · 40 GPM ↗
Applies to: Centrifuge filtration recovery and equipment-relocation evaluation
Centrifuge supplier trial, 22–23 October 2024 — Vendor-developed automatic recipe; 10 GPM was a slow overnight option with occasional checks recommended.
Operating control · Configured trial recipe
Automatic Recipe Flow · 10 GPM ↗
Applies to: Centrifuge filtration recovery and equipment-relocation evaluation
Centrifuge supplier trial, 22–23 October 2024 — Vendor-developed automatic recipe; 10 GPM was a slow overnight option with occasional checks recommended.
Observation · Vendor trial observation
Flow · 40 GPM ↗
Applies to: Winery Centrifuge Trial Prep and Utility Coordination
Recorded flow at 40 GPM; inline EBC and benchtop NTU remain separate instrument observations.
Observation · Vendor trial observation
Inline Inlet Turbidity · 482.9 EBC ↗
Applies to: Winery Centrifuge Trial Prep and Utility Coordination
Recorded inline inlet turbidity at 40 GPM; inline EBC and benchtop NTU remain separate instrument observations.
Observation · Vendor trial observation
Inline Outlet Turbidity · 17.3 EBC ↗
Applies to: Winery Centrifuge Trial Prep and Utility Coordination
Recorded inline outlet turbidity at 40 GPM; inline EBC and benchtop NTU remain separate instrument observations.
Observation · Vendor trial observation
Laboratory Inlet Turbidity · 687 NTU ↗
Applies to: Winery Centrifuge Trial Prep and Utility Coordination
Recorded laboratory inlet turbidity at 40 GPM; inline EBC and benchtop NTU remain separate instrument observations.
Observation · Vendor trial observation
Benchtop Inlet Turbidity · 661 NTU ↗
Applies to: Winery Centrifuge Trial Prep and Utility Coordination
Recorded desk benchtop inlet turbidity at 40 GPM; inline EBC and benchtop NTU remain separate instrument observations.
Observation · Vendor trial observation
Laboratory Outlet Turbidity · 51.7 NTU ↗
Applies to: Winery Centrifuge Trial Prep and Utility Coordination
Recorded laboratory outlet turbidity at 40 GPM; inline EBC and benchtop NTU remain separate instrument observations.
Observation · Vendor trial observation
Benchtop Outlet Turbidity · 46.6 NTU ↗
Applies to: Winery Centrifuge Trial Prep and Utility Coordination
Recorded desk benchtop outlet turbidity at 40 GPM; inline EBC and benchtop NTU remain separate instrument observations.
Observation · Vendor trial observation
Flow · 30 GPM ↗
Applies to: Winery Centrifuge Trial Prep and Utility Coordination
Recorded flow at 30 GPM; inline EBC and benchtop NTU remain separate instrument observations.
Observation · Vendor trial observation
Inline Inlet Turbidity · 490.4 EBC ↗
Applies to: Winery Centrifuge Trial Prep and Utility Coordination
Recorded inline inlet turbidity at 30 GPM; inline EBC and benchtop NTU remain separate instrument observations.
Observation · Vendor trial observation
Inline Outlet Turbidity · 8.3 EBC ↗
Applies to: Winery Centrifuge Trial Prep and Utility Coordination
Recorded inline outlet turbidity at 30 GPM; inline EBC and benchtop NTU remain separate instrument observations.
Observation · Vendor trial observation
Laboratory Outlet Turbidity · 44 NTU ↗
Applies to: Winery Centrifuge Trial Prep and Utility Coordination
Recorded laboratory outlet turbidity at 30 GPM; inline EBC and benchtop NTU remain separate instrument observations.
Observation · Vendor trial observation
Benchtop Outlet Turbidity · 39.7 NTU ↗
Applies to: Winery Centrifuge Trial Prep and Utility Coordination
Recorded desk benchtop outlet turbidity at 30 GPM; inline EBC and benchtop NTU remain separate instrument observations.
Observation · Vendor trial observation
Flow · 20 GPM ↗
Applies to: Winery Centrifuge Trial Prep and Utility Coordination
Recorded flow at 20 GPM; inline EBC and benchtop NTU remain separate instrument observations.
Observation · Vendor trial observation
Inline Inlet Turbidity · 505.5 EBC ↗
Applies to: Winery Centrifuge Trial Prep and Utility Coordination
Recorded inline inlet turbidity at 20 GPM; inline EBC and benchtop NTU remain separate instrument observations.
Observation · Vendor trial observation
Inline Outlet Turbidity · 5.3 EBC ↗
Applies to: Winery Centrifuge Trial Prep and Utility Coordination
Recorded inline outlet turbidity at 20 GPM; inline EBC and benchtop NTU remain separate instrument observations.
Observation · Vendor trial observation
Laboratory Outlet Turbidity · 40.2 NTU ↗
Applies to: Winery Centrifuge Trial Prep and Utility Coordination
Recorded laboratory outlet turbidity at 20 GPM; inline EBC and benchtop NTU remain separate instrument observations.
Observation · Vendor trial observation
Benchtop Outlet Turbidity · 36.5 NTU ↗
Applies to: Winery Centrifuge Trial Prep and Utility Coordination
Recorded desk benchtop outlet turbidity at 20 GPM; inline EBC and benchtop NTU remain separate instrument observations.
Observation · Vendor trial observation
Pre-Nozzle Inline Outlet Turbidity · 52.2 EBC ↗
Applies to: Winery Centrifuge Trial Prep and Utility Coordination
Vendor nozzle-comparison report;66% is the reported reduction, distinct from bench NTU values.
Observation · Vendor trial observation
Post-Nozzle Inline Outlet Turbidity · 17.3 EBC ↗
Applies to: Winery Centrifuge Trial Prep and Utility Coordination
Vendor nozzle-comparison report;66% is the reported reduction, distinct from bench NTU values.
Observation · Vendor trial observation
Reported Outlet-Solids Reduction · 66 % ↗
Applies to: Winery Centrifuge Trial Prep and Utility Coordination
Vendor nozzle-comparison report;66% is the reported reduction, distinct from bench NTU values.
Observation · Vendor trial observation
Comparison Flow · 40 GPM ↗
Applies to: Winery Centrifuge Trial Prep and Utility Coordination
Vendor nozzle-comparison report;66% is the reported reduction, distinct from bench NTU values.
Design parameter · Vendor benchtop comparison method
Additional Benchtop Spin Duration · 10 Min ↗
Applies to: Winery Centrifuge Trial Prep and Utility Coordination
Vendor sample comparison at 40 GPM; supports its interpretation of residual turbidity, not a universal separation guarantee.
Observation · Vendor trial observation
Outlet-Sample Turbidity Before Additional Spin · 46.6 NTU ↗
Applies to: Winery Centrifuge Trial Prep and Utility Coordination
Vendor sample comparison at 40 GPM; supports its interpretation of residual turbidity, not a universal separation guarantee.
Observation · Vendor trial observation
Outlet-Sample Turbidity After Additional Spin · 38.2 NTU ↗
Applies to: Winery Centrifuge Trial Prep and Utility Coordination
Vendor sample comparison at 40 GPM; supports its interpretation of residual turbidity, not a universal separation guarantee.
Baseline · Reported baseline
Earlier Steady-State Turbidity Baseline · 15 to 20 NTU ↗
Applies to: Winery Centrifuge Trial Prep and Utility Coordination
Earlier reported baseline before recent fermentation changes.
Observation · Reported batch context
Recent Fermentation Turbidity · 38 NTU ↗
Applies to: Winery Centrifuge Trial Prep and Utility Coordination
Reported turbidity after fermentation changes such as extra yeast to restart stalled batches.
Scope or inventory quantity · Trial context
Different Batches Filtered · 2 Batch ↗
Applies to: Winery Centrifuge Trial Prep and Utility Coordination
Only two materially different batches had been filtered in over a month, limiting trial comparability.
Observation · Laboratory comparison
Laboratory Centrifuge Outlet Turbidity · 17 to 20 NTU ↗
Applies to: Winery Centrifuge Trial Prep and Utility Coordination
Separate startup assessment; do not merge with later 36–40 NTU fermentation conditions.
Observation · Field comparison
Field Centrifuge Outlet Turbidity at 25 GPM · 21 to 28 NTU ↗
Applies to: Winery Centrifuge Trial Prep and Utility Coordination
Separate startup assessment; do not merge with later 36–40 NTU fermentation conditions.
Estimate · Engineering interpretation
Estimated Dissolved-Impurity Contribution · 10 to 12 NTU ↗
Applies to: Winery Centrifuge Trial Prep and Utility Coordination
Separate startup assessment; do not merge with later 36–40 NTU fermentation conditions.
Baseline · Reported feed baseline
Existing Acetator Feed Turbidity · < 5 NTU ↗
Applies to: Winery Centrifuge Trial Prep and Utility Coordination
Existing feed reported below 5 NTU.
Observation · Field comparison
Field Centrifuge Flow · 25 GPM ↗
Applies to: Winery Centrifuge Trial Prep and Utility Coordination
Flow for the separate 21–28 NTU field assessment.
Observation · Operator trial observation
Operator-Reported Flow · 40 GPM ↗
Applies to: Centrifuge filtration recovery and equipment-relocation evaluation
Centrifuge supplier operator report, 25 October 2024 — Operator report of the stated run; no reported issues during this 5,500 gallon observation.
Observation · Operator trial observation
Operator-Reported Outlet Turbidity · 21 NTU ↗
Applies to: Centrifuge filtration recovery and equipment-relocation evaluation
Centrifuge supplier operator report, 25 October 2024 — Operator report of the stated run; no reported issues during this 5,500 gallon observation.
Observation · Operator trial observation
Operator-Reported Processed Volume · 5,500 Gal ↗
Applies to: Centrifuge filtration recovery and equipment-relocation evaluation
Centrifuge supplier operator report, 25 October 2024 — Operator report of the stated run; no reported issues during this 5,500 gallon observation.
Scenario or model result · Operating model
Fermenter Volume · 26,000 Gal ↗
Applies to: Winery Centrifuge Trial Prep and Utility Coordination
Operating-window sizing calculation, not a completed-batch performance result.
Scenario or model result · Operating model
Available Filtration Window · 17.5 H ↗
Applies to: Winery Centrifuge Trial Prep and Utility Coordination
Operating-window sizing calculation, not a completed-batch performance result.
Scenario or model result · Operating model
Modeled Filtration Flow · 25 GPM ↗
Applies to: Winery Centrifuge Trial Prep and Utility Coordination
Operating-window sizing calculation, not a completed-batch performance result.
Scenario or model result · Operating model
Calculated Window Capacity · 26,250 Gal ↗
Applies to: Winery Centrifuge Trial Prep and Utility Coordination
Operating-window sizing calculation, not a completed-batch performance result.
Target · Schedule target
Post-PO Completion Target · 3 Weeks ↗
Applies to: Winery Centrifuge Filtration
AFE acceptance plan — Completion target following purchase-order issuance for the winery centrifuge.
Estimate · Supplier lead-time estimate
Dynamic Turbidity-Control Lead-Time Increment · 6 to 8 Weeks ↗
Applies to: Centrifuge Supplier Evaluation and Manufacturing Maturity Scorecard
Centrifuge supplier option comparison — Additional build time for the dynamic flow-control option.
Equipment rating · Supplier sizing reference
DB-2012 Quoted Flow Range · 40 to 50 GPM ↗
Applies to: Centrifuge Supplier Evaluation and Manufacturing Maturity Scorecard
Centrifuge supplier option comparison — DB-2012 vendor flow range for equipment comparison.
Equipment rating · Supplier sizing reference
DB-4525 Quoted Flow Range · 80 to 100 GPM ↗
Applies to: Centrifuge Supplier Evaluation and Manufacturing Maturity Scorecard
Centrifuge supplier option comparison — DB-4525 vendor flow range for equipment comparison.
Equipment rating · Supplier sizing reference
DB-6052 Quoted Flow Range · 160 to 200 GPM ↗
Applies to: Centrifuge Supplier Evaluation and Manufacturing Maturity Scorecard
Centrifuge supplier option comparison — DB-6052 vendor flow range for equipment comparison.
Design parameter · Supplier sizing reference
Vendor Sizing Example Flow · 30 GPM ↗
Applies to: Centrifuge Supplier Evaluation and Manufacturing Maturity Scorecard
Centrifuge supplier application discussion — Flow used in the supplier solids-discharge sizing example.
Design parameter · Supplier sizing reference
Vendor Sizing Example Equivalent Flow · 114 L/Min ↗
Applies to: Centrifuge Supplier Evaluation and Manufacturing Maturity Scorecard
Centrifuge supplier application discussion — Supplier-stated equivalent flow, retained without replacing it with a newly rounded conversion.
Design parameter · Supplier sizing reference
Vendor Sizing Example Feed Solids · 0.5 % ↗
Applies to: Centrifuge Supplier Evaluation and Manufacturing Maturity Scorecard
Centrifuge supplier application discussion — Solids basis used in the supplier sizing example.
Scenario or model result · Supplier sizing reference
Vendor Sizing Example Discharge Interval · 7.9 Min ↗
Applies to: Centrifuge Supplier Evaluation and Manufacturing Maturity Scorecard
Centrifuge supplier application discussion — Calculated discharge interval stated by the supplier at the example feed.
Design parameter · Supplier sizing reference
Vendor Solids-Hold Concern · 20 Min ↗
Applies to: Centrifuge Supplier Evaluation and Manufacturing Maturity Scorecard
Centrifuge supplier application discussion — Hold duration discussed as a solids-packing concern, not an approved timer setting.
Historical/reference value · Supplier comparison reference
Vendor Comparison Backpressure Range · 5 to 6 Bar ↗
Applies to: Centrifuge Supplier Evaluation and Manufacturing Maturity Scorecard
Open-bowl design discussion — Backpressure range discussed in the supplier design comparison.
Operating control · Supplier maintenance guidance
Initial Oil-Change Interval · 300 H ↗
Applies to: Centrifuge Supplier Evaluation and Manufacturing Maturity Scorecard
Centrifuge supplier first service — Initial oil-change interval preceding the recurring 750-hour interval.
Target · Schedule basis
Rental-Trial Planning Period · 1 Month ↗
Applies to: Centrifuge filtration recovery and equipment-relocation evaluation
rental trial — Duration used for the trial installation planning.
Target · Requirement
Minimum Comparison Flow Requirement · >= 25 GPM ↗
Applies to: Winery Centrifuge Trial Prep and Utility Coordination
supplier comparison — Requested minimum throughput for the vendor comparison.
Target · Operating alternative
Higher-Turbidity Flow Alternative · 40 to 50 GPM ↗
Applies to: Winery Centrifuge Trial Prep and Utility Coordination
supplier comparison — Flow alternative discussed with higher outlet turbidity.
Design parameter · Design basis
Annual Design-Load Scenario · Approximately 5,000,000 Gal/Year ↗
Applies to: Winery Centrifuge Trial Prep and Utility Coordination
centrifuge sizing — Approximate annual throughput used in one supplier-sizing scenario.
Design parameter · Design basis
Weekly Product-Load Scenario 1 · 40,000 Gal/Week ↗
Applies to: Winery Centrifuge Trial Prep and Utility Coordination
centrifuge sizing — One of three separately listed weekly product loads in the sizing discussion.
Design parameter · Design basis
Weekly Product-Load Scenario 2 · 40,000 Gal/Week ↗
Applies to: Winery Centrifuge Trial Prep and Utility Coordination
centrifuge sizing — One of three separately listed weekly product loads in the sizing discussion.
Design parameter · Design basis
Weekly Product-Load Scenario 3 · 9,000 Gal/Week ↗
Applies to: Winery Centrifuge Trial Prep and Utility Coordination
centrifuge sizing — One of three separately listed weekly product loads in the sizing discussion.
Unresolved value · Planning question
FY 25 Production Planning Question · 8,600,000 Gal/Year ↗
Applies to: Winery Centrifuge Trial Prep and Utility Coordination
FY 25 discussion — Annual figure raised for confirmation in the later planning discussion.
Target · Operating alternative
Temporary Clarity-Focused Flow Alternative · 15 to 20 GPM ↗
Applies to: Winery Centrifuge Trial Prep and Utility Coordination
acetator acclimation review — Lower flow considered while checking solids removal and acetator response.
Observation · Reported comparison
Centrifuge Supplier Comparison Inlet Turbidity · > 2,000 NTU ↗
Applies to: Centrifuge Trial Performance, Documentation, and Supplier Tradeoff Analysis
Cross-site 50 GPM comparison — feed used in the cross-site comparison.
Observation · Reported comparison
Centrifuge Supplier Comparison Outlet Turbidity · Approximately 23 NTU ↗
Applies to: Centrifuge Trial Performance, Documentation, and Supplier Tradeoff Analysis
Cross-site 50 GPM comparison — Centrifuge supplier outlet quoted in the comparison.
Observation · Reported comparison
Brew 250 Comparison Inlet Turbidity · 1,800 NTU ↗
Applies to: Centrifuge Trial Performance, Documentation, and Supplier Tradeoff Analysis
Cross-site 50 GPM comparison — Brew 250 feed reported in the comparison; a different feed from the comparison-facility example.
Observation · Reported comparison
Brew 250 Comparison Outlet Turbidity · > 30 NTU ↗
Applies to: Centrifuge Trial Performance, Documentation, and Supplier Tradeoff Analysis
Cross-site 50 GPM comparison — Brew 250 outlet reported for the comparison.
Target · Target
Comparison Outlet Criterion · < 40 NTU ↗
Applies to: Centrifuge Trial Performance, Documentation, and Supplier Tradeoff Analysis
Cross-site 50 GPM comparison — comparison-facility acceptance objective discussed with 50 GPM throughput.
Observation · Reported comparison
Cross-Site Comparison Nominal Flow · 50 GPM ↗
Applies to: Centrifuge Trial Performance, Documentation, and Supplier Tradeoff Analysis
Cross-site 50 GPM comparison — Nominal flow common to both cited examples; feeds and operating conditions differed.
Observation · Plant-reported operating context
Apple-Wine Inlet Turbidity · > 2,000 NTU ↗
Applies to: Centrifuge filtration recovery and equipment-relocation evaluation
comparison-facility apple wine from fermenters — Incoming apple wine was described as above 2000 NTU.
Target · Plant preference
Apple-Wine Outlet Criterion · <= 60 NTU ↗
Applies to: Centrifuge filtration recovery and equipment-relocation evaluation
comparison-facility apple wine to acetators — Desired outlet of 60 NTU or less.
Observation · Plant-reported operating context
Cider Inlet Turbidity · 750 NTU ↗
Applies to: Centrifuge filtration recovery and equipment-relocation evaluation
comparison-facility acetator cider to membrane-filter feed tank — Typical incoming cider reference.
Target · Plant preference
Cider Outlet Criterion · <= 50 NTU ↗
Applies to: Centrifuge filtration recovery and equipment-relocation evaluation
comparison-facility acetator cider to membrane-filter feed tank — Typical desired outlet at or below 50 NTU depending on speed.
Observation · Plant-reported operating context
WDV Circulation Inlet Turbidity · > 1,800 NTU ↗
Applies to: Centrifuge filtration recovery and equipment-relocation evaluation
comparison-facility white-distilled-vinegar membrane-filter circulation — Incoming recirculation stream was described as above 1800 NTU.
Observation · Plant-reported operating context
WDV Circulation Outlet Turbidity · 350 NTU ↗
Applies to: Centrifuge filtration recovery and equipment-relocation evaluation
comparison-facility white-distilled-vinegar membrane-filter circulation — Outlet reported while recirculating to remove solids.
Observation · Plant-reported operating context
WDV Circulation Flow · 25 GPM ↗
Applies to: Centrifuge filtration recovery and equipment-relocation evaluation
comparison-facility white-distilled-vinegar membrane-filter circulation — Flow reported for the recirculation example.
Observation · Plant-reported operating context
WDV Circulation Duration · Approximately 8 H ↗
Applies to: Centrifuge filtration recovery and equipment-relocation evaluation
comparison-facility white-distilled-vinegar membrane-filter circulation — Approximate duration of the recirculation run.
Observation · Plant-reported operating context
High-Clarity Wine Outlet Turbidity · 4 to 8 NTU ↗
Applies to: Centrifuge SPO, Supplier Evaluation, and Lessons-Learned Transfer
wine clarification — reported high-clarity wine range.
Observation · Plant-reported operating context
High-Clarity Wine Flow · 10 to 12 GPM ↗
Applies to: Centrifuge SPO, Supplier Evaluation, and Lessons-Learned Transfer
wine clarification — flow corresponding to the clarity-focused duty.
Observation · Plant-reported operating context
Rice/Cider Feed Turbidity · 700 to 800 NTU ↗
Applies to: Centrifuge SPO, Supplier Evaluation, and Lessons-Learned Transfer
wine clarification — rice/cider feed example used in the site comparison.
Equipment rating · Supplier sizing reference
Quoted Comparison System Flow · 30 GPM ↗
Applies to: Centrifuge SPO, Supplier Evaluation, and Lessons-Learned Transfer
wine clarification — Quoted system throughput contrasted with actual high-clarity duty.
Baseline · Planning reference
Apple and Rice Product Share Reference · Approximately 80 % ↗
Applies to: Centrifuge SPO, Supplier Evaluation, and Lessons-Learned Transfer
Cross-site supplier review — Approximate production share used to prioritize apple/rice application testing.
Equipment rating · Equipment design reference
Separator Load Reference · 22 kW ↗
Applies to: Centrifuge Supplier Evaluation and Manufacturing Maturity Scorecard
Supplier electrical comparison — Separator component load in the centrifuge supplier comparison.
Equipment rating · Equipment design reference
Centrifuge Supplier Solids-Pump Load Reference · 1.5 kW ↗
Applies to: Centrifuge Supplier Evaluation and Manufacturing Maturity Scorecard
Supplier electrical comparison — Solids-pump component load in the centrifuge supplier comparison.
Design parameter · Equipment design reference
Centrifuge Supplier Service Load Reference · 25 kW ↗
Applies to: Centrifuge Supplier Evaluation and Manufacturing Maturity Scorecard
Supplier electrical comparison — Service-load reference used in vendor energy questions.
Equipment rating · Equipment design reference
Brew 250 Separator Load Reference · 18.5 kW ↗
Applies to: Centrifuge Supplier Evaluation and Manufacturing Maturity Scorecard
Supplier electrical comparison — Separator component in the Brew 250 one-line.
Equipment rating · Equipment design reference
Brew 250 Solids-Pump Load Reference · 3 kW ↗
Applies to: Centrifuge Supplier Evaluation and Manufacturing Maturity Scorecard
Supplier electrical comparison — Solids-pump component in the Brew 250 one-line.
Equipment rating · Equipment design reference
Brew 250 Feed-Pump Load Reference · 4.8 kW ↗
Applies to: Centrifuge Supplier Evaluation and Manufacturing Maturity Scorecard
Supplier electrical comparison — Feed-pump component in the Brew 250 one-line.
Design parameter · Equipment design reference
Brew 250 Listed Component Total · 26.3 kW ↗
Applies to: Centrifuge Supplier Evaluation and Manufacturing Maturity Scorecard
Supplier electrical comparison — Sum of the three listed Brew 250 component loads.
Design parameter · Equipment design reference
Clara 250 Service Load Reference · Approximately 40 kW ↗
Applies to: Centrifuge Supplier Evaluation and Manufacturing Maturity Scorecard
Supplier electrical comparison — Approximate service requirement raised in the comparison question.
Equipment rating · Supplier supply requirement
Brew 250 Recommended Supply Current · 80 A ↗
Applies to: Centrifuge Supplier Evaluation and Manufacturing Maturity Scorecard
Brew 250 three-phase service — Supplier-recommended supply capacity, distinct from operating demand.
Equipment rating · Supplier supply requirement
Brew 250 Supply Voltage · 460 V ↗
Applies to: Centrifuge Supplier Evaluation and Manufacturing Maturity Scorecard
Brew 250 three-phase service — Three-phase supply voltage in the feed-pump/main-panel discussion.
Baseline · Plant-reported cost context
Reported Filtration Batch Volume · 6,000 Gal ↗
Applies to: Centrifuge SPO, Supplier Evaluation, and Lessons-Learned Transfer
Vinegar filtration comparison — Batch volume underlying the cost examples.
Equipment rating · Equipment reference
Existing Alcohol-Pump Rated Flow · 55 to 70 GPM ↗
Applies to: Plant Operations Support, Maintenance Troubleshooting, and Production Reliability Support
flood-remediation review — Existing pumps were oversized relative to dosing demand.
Observation · Reported operating condition
Throttled Alcohol-Feed Flow · 2.9 GPM ↗
Applies to: Plant Operations Support, Maintenance Troubleshooting, and Production Reliability Support
flood-remediation review — Butterfly-valve throttling reduced flow while pumps repeatedly short-cycled.
Observation · Recorded work duration
Technical-Support Investigation Duration · 6 H ↗
Applies to: Plant Operations Support, Maintenance Troubleshooting, and Production Reliability Support
Acetator trend investigation — Time spent with controls software supplier support during the reported investigation.
Observation · Reported diagnostic condition
Unintended Outfeed Reference Flow · Approximately 10 GPM ↗
Applies to: Centrifuge SPO, Supplier Evaluation, and Lessons-Learned Transfer
Drain-valve failure review — Flow loss used to assess meter detection and PLC classification.
Operating control · Supplier maintenance guidance
Seal Evaluation Pressure Guidance · < 120 psi ↗
Applies to: Centrifuge Trial Performance, Documentation, and Supplier Tradeoff Analysis
Trial seal inspection planning — Supplier suggested operating below this outlet pressure when evaluating seal wear.
Design parameter · Supplier comparison reference
Seal Evaluation Comparison Pressure · 145 psi ↗
Applies to: Centrifuge Trial Performance, Documentation, and Supplier Tradeoff Analysis
Trial seal inspection planning — Higher pressure used in the supplier seal-life discussion.
Design parameter · Installation planning
Fermenter Manifold to Pass-Through Hose Length · 25 ft ↗
Applies to: Winery Centrifuge Trial Prep and Utility Coordination
Temporary trial hose schedule — Fermenter manifold to pass-through.
Design parameter · Installation planning
Pass-Through to Feed-Pump Inlet Hose Length · 15 ft ↗
Applies to: Winery Centrifuge Trial Prep and Utility Coordination
Temporary trial hose schedule — Pass-through to feed-pump inlet.
Design parameter · Installation planning
Feed Pump to Centrifuge Hose Length · 15 ft ↗
Applies to: Winery Centrifuge Trial Prep and Utility Coordination
Temporary trial hose schedule — Feed pump to centrifuge.
Design parameter · Installation planning
Product Outlet to Storage Pipe Hose Length · 10 ft ↗
Applies to: Winery Centrifuge Trial Prep and Utility Coordination
Temporary trial hose schedule — Product outlet to storage pipe.
Design parameter · Installation planning
Waste-Hose Length · 30 ft ↗
Applies to: Winery Centrifuge Trial Prep and Utility Coordination
Temporary trial hose schedule — Waste hose.
Design parameter · Installation planning
CIP Tank to Pump Hose Length · 20 ft ↗
Applies to: Winery Centrifuge Trial Prep and Utility Coordination
Temporary trial hose schedule — CIP tank to pump.
Design parameter · Installation planning
Centrifuge to CIP-Tank Top Hose Length · 30 ft ↗
Applies to: Winery Centrifuge Trial Prep and Utility Coordination
Temporary trial hose schedule — Centrifuge to CIP-tank top.
Equipment rating · Installation planning
CIP Tank Purchasing Alternative · 100 Gal ↗
Applies to: Winery Centrifuge Trial Prep and Utility Coordination
site readiness — Tank purchase alternative if the existing larger poly tank was unavailable.
Design parameter · Installation planning
Optional Trial Ethernet Run · 150 ft ↗
Applies to: Centrifuge filtration recovery and equipment-relocation evaluation
trial connectivity — Cable option conditional on IT and supplier remote-support need.
Design parameter · Installation planning
Engineering-Network Ethernet Route · 100 to 200 ft ↗
Applies to: Winery Centrifuge Trial Prep and Utility Coordination
engineering network — Approximate route to the QA-lab master switch.
Target · Schedule request
Additional Operator-Training Request · Approximately 1 Day ↗
Applies to: Winery Centrifuge Trial Prep and Utility Coordination
Supplier startup planning — Requested extra training duration subject to pricing.
Historical/reference value · Project-family rollup
Project-Family Portfolio Value · 15,995,000 USD ↗
Applies to: Steam and Boiler System Modernization
Portfolio family summary — Boiler System + Plant Steam & Condensate Optimization family value in the workstream summary; separate from the named-project value and not additive to its parent workstream total.
Historical/reference value · Project-family rollup
Project-Family Portfolio Value · 250,000 USD ↗
Applies to: Steam and Boiler System Modernization
Portfolio family summary — Reduction System Steam Repair and Temperature Control Retrofit family value in the workstream summary; separate from the named-project value and not additive to its parent workstream total.
Historical/reference value · Project-family rollup
Project-Family Portfolio Value · 52,000 USD ↗
Applies to: Steam and Boiler System Modernization
Portfolio family summary — Shipping Warehouse Temperature Reduction and Boiler Room Exhaust Ventilation family value in the workstream summary; separate from the named-project value and not additive to its parent workstream total.
Historical/reference value · Project-family rollup
Project-Family Portfolio Value · 531,000 USD ↗
Applies to: Cooling and Utility Reliability Modernization
Portfolio family summary — 250 Ton Chiller Standby Capacity family value in the workstream summary; separate from the named-project value and not additive to its parent workstream total.
Historical/reference value · Project-family rollup
Project-Family Portfolio Value · 100,000 USD ↗
Applies to: Cooling and Utility Reliability Modernization
Portfolio family summary — Acetator A5 Upgrade and Cooling Coordination family value in the workstream summary; separate from the named-project value and not additive to its parent workstream total.
Historical/reference value · Project-family rollup
Project-Family Portfolio Value · 5,202,000 USD ↗
Applies to: Cooling and Utility Reliability Modernization
Portfolio family summary — Production-cooling upgrade with three 160-ton chillers family value in the workstream summary; separate from the named-project value and not additive to its parent workstream total.
Historical/reference value · Project-family rollup
Project-Family Portfolio Value · 8,415,000 USD ↗
Applies to: Cooling and Utility Reliability Modernization
Portfolio family summary — Cooling Tower, Chiller Circuit, and Injection Well Retrofit family value in the workstream summary; separate from the named-project value and not additive to its parent workstream total.
Historical/reference value · Project-family rollup
Project-Family Portfolio Value · 750,000 USD ↗
Applies to: Cooling and Utility Reliability Modernization
Portfolio family summary — Fermenter & Acetator Cooling Alarm System family value in the workstream summary; separate from the named-project value and not additive to its parent workstream total.
Historical/reference value · Project-family rollup
Project-Family Portfolio Value · 347,000 USD ↗
Applies to: Wine Clarification and Vinegar Polishing Modernization
Portfolio family summary — Centrifuge Filtration System family value in the workstream summary; separate from the named-project value and not additive to its parent workstream total.
Historical/reference value · Project-family rollup
Project-Family Portfolio Value · 12,159,000 USD ↗
Applies to: Wine Clarification and Vinegar Polishing Modernization
Portfolio family summary — Ceramic Crossflow Filter System + Ion Exchange Trial family value in the workstream summary; separate from the named-project value and not additive to its parent workstream total.
Historical/reference value · Project-family rollup
Project-Family Portfolio Value · 347,000 USD ↗
Applies to: Wine Clarification and Vinegar Polishing Modernization
Portfolio family summary — Centrifuge Filtration System family value in the workstream summary; separate from the named-project value and not additive to its parent workstream total.
Historical/reference value · Project-family rollup
Project-Family Portfolio Value · 334,000 USD ↗
Applies to: Wine Clarification and Vinegar Polishing Modernization
Portfolio family summary — Centrifuge Installation and Interface Engineering family value in the workstream summary; separate from the named-project value and not additive to its parent workstream total.
Historical/reference value · Project-family rollup
Project-Family Portfolio Value · 235,000 USD ↗
Applies to: Wine Clarification and Vinegar Polishing Modernization
Portfolio family summary — Centrifuge Filtration family value in the workstream summary; separate from the named-project value and not additive to its parent workstream total.
Historical/reference value · Project-family rollup
Project-Family Portfolio Value · 4,495,000 USD ↗
Applies to: Wine Clarification and Vinegar Polishing Modernization
Portfolio family summary — Winery Centrifuge Filtration family value in the workstream summary; separate from the named-project value and not additive to its parent workstream total.
Historical/reference value · Project-family rollup
Project-Family Portfolio Value · 400,000 USD ↗
Applies to: Wine Clarification and Vinegar Polishing Modernization
Portfolio family summary — Winery Centrifuge and CIP Interface Engineering + Vinegar Transfer Centrifuge Loop family value in the workstream summary; separate from the named-project value and not additive to its parent workstream total.
Historical/reference value · Project-family rollup
Project-Family Portfolio Value · 230,000 USD ↗
Applies to: Production and Packaging Modernization
Portfolio family summary — Line 1 Filler and Conveyor Upgrade family value in the workstream summary; separate from the named-project value and not additive to its parent workstream total.
Historical/reference value · Project-family rollup
Project-Family Portfolio Value · 314,000 USD ↗
Applies to: Production and Packaging Modernization
Portfolio family summary — Line 1 Mixer Bottle Conversion to 28 mm PCO family value in the workstream summary; separate from the named-project value and not additive to its parent workstream total.
Historical/reference value · Project-family rollup
Project-Family Portfolio Value · 150,000 USD ↗
Applies to: Production and Packaging Modernization
Portfolio family summary — Line 1 Pasteurizer Repair family value in the workstream summary; separate from the named-project value and not additive to its parent workstream total.
Historical/reference value · Project-family rollup
Project-Family Portfolio Value · 900,000 USD ↗
Applies to: Production and Packaging Modernization
Portfolio family summary — Line 2 Pasteurizer Upgrades family value in the workstream summary; separate from the named-project value and not additive to its parent workstream total.
Historical/reference value · Project-family rollup
Project-Family Portfolio Value · 26,501,000 USD ↗
Applies to: Production and Packaging Modernization
Portfolio family summary — Lines 1 & 2 Bottling and Packaging Lines family value in the workstream summary; separate from the named-project value and not additive to its parent workstream total.
Historical/reference value · Project-family rollup
Project-Family Portfolio Value · 3,055,000 USD ↗
Applies to: OT Network and Controls Transformation
Portfolio family summary — Fiberoptic OT Network family value in the workstream summary; separate from the named-project value and not additive to its parent workstream total.
Historical/reference value · Project-family rollup
Project-Family Portfolio Value · 444,000 USD ↗
Applies to: OT Network and Controls Transformation
Portfolio family summary — Tank Level Measurement System Standardization family value in the workstream summary; separate from the named-project value and not additive to its parent workstream total.
Historical/reference value · Project-family rollup
Project-Family Portfolio Value · 501,000 USD ↗
Applies to: OT Network and Controls Transformation
Portfolio family summary — Tank Level Monitoring Standardization family value in the workstream summary; separate from the named-project value and not additive to its parent workstream total.
Historical/reference value · Project-family rollup
Project-Family Portfolio Value · 459,000 USD ↗
Applies to: OT Network and Controls Transformation
Portfolio family summary — Tank Measurement Project standardization family value in the workstream summary; separate from the named-project value and not additive to its parent workstream total.
Historical/reference value · Project-family rollup
Project-Family Portfolio Value · 483,000 USD ↗
Applies to: OT Network and Controls Transformation
Portfolio family summary — Tank Measurement System Standardization family value in the workstream summary; separate from the named-project value and not additive to its parent workstream total.
Historical/reference value · Project-family rollup
Project-Family Portfolio Value · 9,900,000 USD ↗
Applies to: Chemical Dosing and Storage Modernization
Portfolio family summary — Line 1 Capper and Conveyor Upgrade + Bulk Nitrogen Transition family value in the workstream summary; separate from the named-project value and not additive to its parent workstream total.
Historical/reference value · Project-family rollup
Project-Family Portfolio Value · 2,475,000 USD ↗
Applies to: Chemical Dosing and Storage Modernization
Portfolio family summary — Nitrogen Dosing, Automated Microbulk Refill Station+ Storage Tank Conversion family value in the workstream summary; separate from the named-project value and not additive to its parent workstream total.
Historical/reference value · Project-family rollup
Project-Family Portfolio Value · 150,000 USD ↗
Applies to: Environmental Compliance and Recovery Systems
Portfolio family summary — Filtering Room Acetator Electrical Control Room (SHI-25) family value in the workstream summary; separate from the named-project value and not additive to its parent workstream total.
Historical/reference value · Project-family rollup
Project-Family Portfolio Value · 5,545,000 USD ↗
Applies to: Environmental Compliance and Recovery Systems
Portfolio family summary — Site Enhancements, Drainage Erosion Mitigation, and Runoff Controls family value in the workstream summary; separate from the named-project value and not additive to its parent workstream total.
Historical/reference value · Portfolio rollup
Workstream Portfolio Rollup · 13,500,000 USD ↗
Applies to: Chemical Dosing and Storage Modernization
Portfolio financial architecture — Chemical Dosing and Storage Modernization: workstream portfolio rollup. Separate financial basis; not additive to the total employer portfolio.
Historical/reference value · Detailed-project value
Workstream Detailed-Project Value · 12,375,000 USD ↗
Applies to: Chemical Dosing and Storage Modernization
Portfolio financial architecture — Chemical Dosing and Storage Modernization: workstream detailed-project value. Separate financial basis; not additive to the total employer portfolio.
Historical/reference value · Existing-project value
Workstream Existing-Project Value · 1,125,000 USD ↗
Applies to: Chemical Dosing and Storage Modernization
Portfolio financial architecture — Chemical Dosing and Storage Modernization: workstream existing-project value. Separate financial basis; not additive to the total employer portfolio.
Historical/reference value · Portfolio rollup
Workstream Portfolio Rollup · 14,998,000 USD ↗
Applies to: Cooling and Utility Reliability Modernization
Portfolio financial architecture — Cooling and Utility Reliability Modernization: workstream portfolio rollup. Separate financial basis; not additive to the total employer portfolio.
Historical/reference value · Detailed-project value
Workstream Detailed-Project Value · 11,717,000 USD ↗
Applies to: Cooling and Utility Reliability Modernization
Portfolio financial architecture — Cooling and Utility Reliability Modernization: workstream detailed-project value. Separate financial basis; not additive to the total employer portfolio.
Historical/reference value · Existing-project value
Workstream Existing-Project Value · 3,281,000 USD ↗
Applies to: Cooling and Utility Reliability Modernization
Portfolio financial architecture — Cooling and Utility Reliability Modernization: workstream existing-project value. Separate financial basis; not additive to the total employer portfolio.
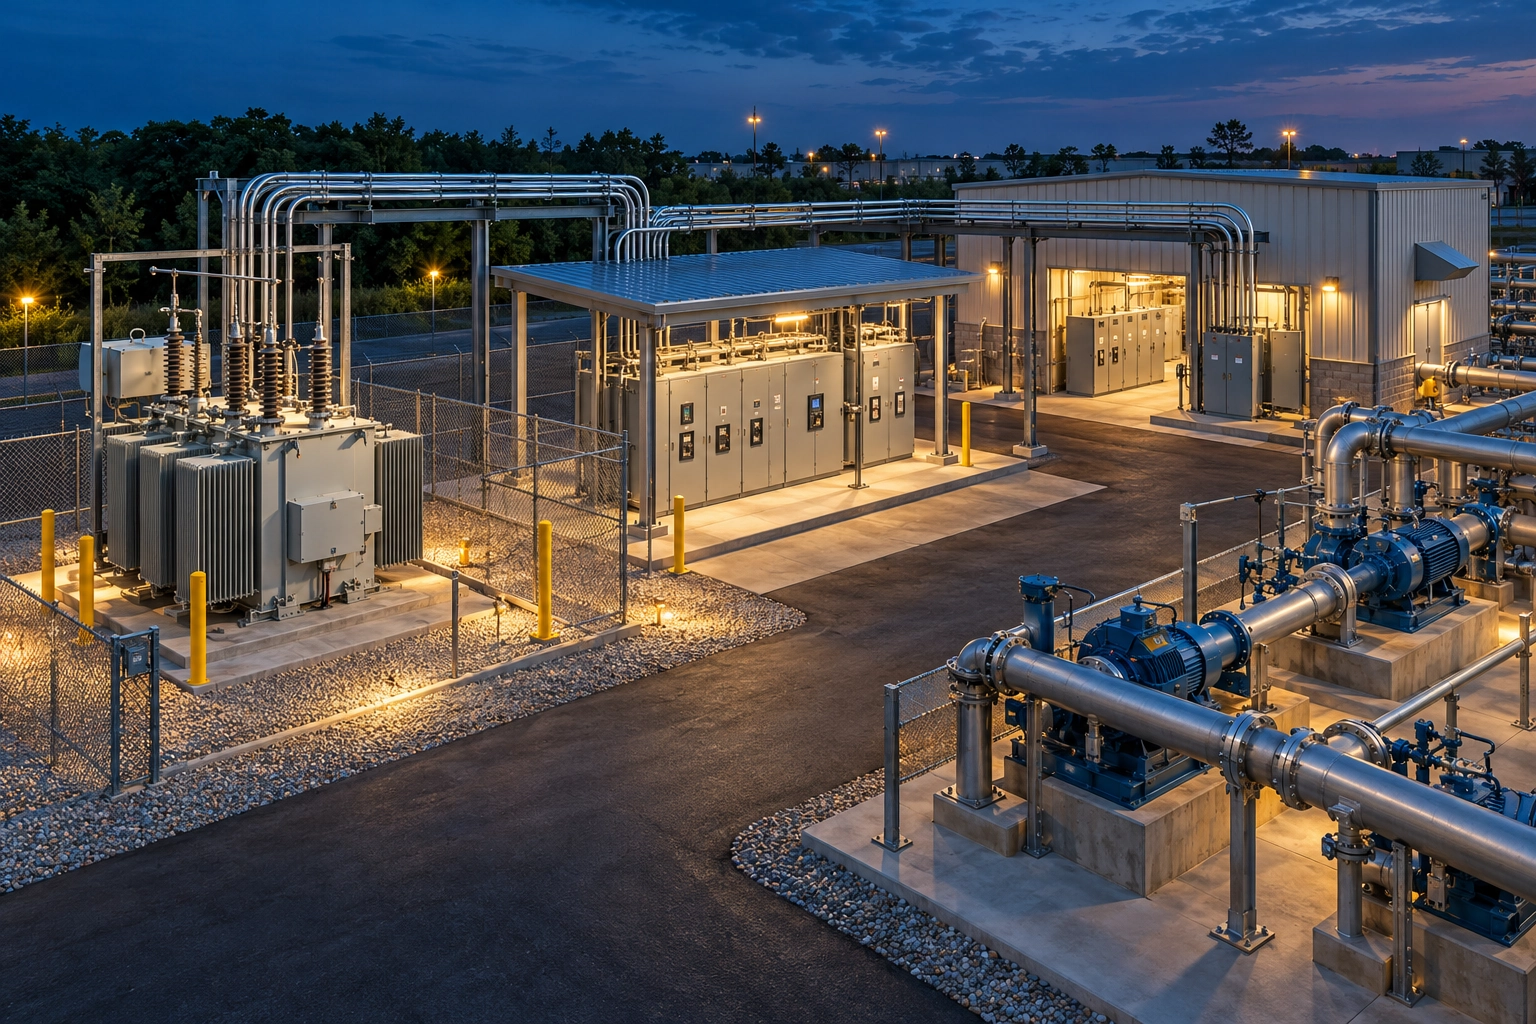
Historical/reference value · Portfolio rollup
Workstream Portfolio Rollup · 15,255,000 USD ↗
Applies to: Electrical Infrastructure Modernization
Portfolio financial architecture — Electrical Infrastructure Modernization: expanded portfolio value includes the original 5,555,000 USD scope and one 9,700,000 USD electrical-service project contribution.
Historical/reference value · Detailed-project value
Workstream Detailed-Project Value · 5,055,000 USD ↗
Applies to: Electrical Infrastructure Modernization
Portfolio financial architecture — Electrical Infrastructure Modernization: workstream detailed-project value. Separate financial basis; not additive to the total employer portfolio.
Historical/reference value · Existing-project value
Workstream Existing-Project Value · 500,000 USD ↗
Applies to: Electrical Infrastructure Modernization
Portfolio financial architecture — Electrical Infrastructure Modernization: workstream existing-project value. Separate financial basis; not additive to the total employer portfolio.
Historical/reference value · Portfolio rollup
Workstream Portfolio Rollup · 5,695,000 USD ↗
Applies to: Environmental Compliance and Recovery Systems
Portfolio financial architecture — Environmental Compliance and Recovery Systems: workstream portfolio rollup. Separate financial basis; not additive to the total employer portfolio.
Historical/reference value · Detailed-project value
Workstream Detailed-Project Value · 5,045,000 USD ↗
Applies to: Environmental Compliance and Recovery Systems
Portfolio financial architecture — Environmental Compliance and Recovery Systems: workstream detailed-project value. Separate financial basis; not additive to the total employer portfolio.
Historical/reference value · Existing-project value
Workstream Existing-Project Value · 650,000 USD ↗
Applies to: Environmental Compliance and Recovery Systems
Portfolio financial architecture — Environmental Compliance and Recovery Systems: workstream existing-project value. Separate financial basis; not additive to the total employer portfolio.
Historical/reference value · Portfolio rollup
Workstream Portfolio Rollup · 4,942,000 USD ↗
Applies to: OT Network and Controls Transformation
Portfolio financial architecture — OT Network and Controls Transformation: workstream portfolio rollup. Separate financial basis; not additive to the total employer portfolio.
Historical/reference value · Detailed-project value
Workstream Detailed-Project Value · 4,063,000 USD ↗
Applies to: OT Network and Controls Transformation
Portfolio financial architecture — OT Network and Controls Transformation: workstream detailed-project value. Separate financial basis; not additive to the total employer portfolio.
Historical/reference value · Existing-project value
Workstream Existing-Project Value · 879,000 USD ↗
Applies to: OT Network and Controls Transformation
Portfolio financial architecture — OT Network and Controls Transformation: workstream existing-project value. Separate financial basis; not additive to the total employer portfolio.
Historical/reference value · Portfolio rollup
Workstream Portfolio Rollup · 28,095,000 USD ↗
Applies to: Production and Packaging Modernization
Portfolio financial architecture — Production and Packaging Modernization: workstream portfolio rollup. Separate financial basis; not additive to the total employer portfolio.
Historical/reference value · Detailed-project value
Workstream Detailed-Project Value · 21,201,000 USD ↗
Applies to: Production and Packaging Modernization
Portfolio financial architecture — Production and Packaging Modernization: workstream detailed-project value. Separate financial basis; not additive to the total employer portfolio.
Historical/reference value · Existing-project value
Workstream Existing-Project Value · 6,894,000 USD ↗
Applies to: Production and Packaging Modernization
Portfolio financial architecture — Production and Packaging Modernization: workstream existing-project value. Separate financial basis; not additive to the total employer portfolio.
Historical/reference value · Portfolio rollup
Workstream Portfolio Rollup · 16,297,000 USD ↗
Applies to: Steam and Boiler System Modernization
Portfolio financial architecture — Steam and Boiler System Modernization: workstream portfolio rollup. Separate financial basis; not additive to the total employer portfolio.
Historical/reference value · Detailed-project value
Workstream Detailed-Project Value · 14,545,000 USD ↗
Applies to: Steam and Boiler System Modernization
Portfolio financial architecture — Steam and Boiler System Modernization: workstream detailed-project value. Separate financial basis; not additive to the total employer portfolio.
Historical/reference value · Existing-project value
Workstream Existing-Project Value · 1,752,000 USD ↗
Applies to: Steam and Boiler System Modernization
Portfolio financial architecture — Steam and Boiler System Modernization: workstream existing-project value. Separate financial basis; not additive to the total employer portfolio.
Historical/reference value · Portfolio rollup
Workstream Portfolio Rollup · 66,885,000 USD ↗
Applies to: Vinegar Acetation and Fermentation-Support Modernization
Portfolio financial architecture — Vinegar Acetation and Fermentation-Support Modernization: workstream portfolio rollup. Separate financial basis; not additive to the total employer portfolio.
Historical/reference value · Detailed-project value
Workstream Detailed-Project Value · 48,828,000 USD ↗
Applies to: Vinegar Acetation and Fermentation-Support Modernization
Portfolio financial architecture — Vinegar Acetation and Fermentation-Support Modernization: workstream detailed-project value. Separate financial basis; not additive to the total employer portfolio.
Historical/reference value · Existing-project value
Workstream Existing-Project Value · 18,057,000 USD ↗
Applies to: Vinegar Acetation and Fermentation-Support Modernization
Portfolio financial architecture — Vinegar Acetation and Fermentation-Support Modernization: workstream existing-project value. Separate financial basis; not additive to the total employer portfolio.
Historical/reference value · Portfolio rollup
Workstream Portfolio Rollup · 18,317,000 USD ↗
Applies to: Wine Clarification and Vinegar Polishing Modernization
Portfolio financial architecture — Wine Clarification and Vinegar Polishing Modernization: workstream portfolio rollup. Separate financial basis; not additive to the total employer portfolio.
Historical/reference value · Detailed-project value
Workstream Detailed-Project Value · 15,184,000 USD ↗
Applies to: Wine Clarification and Vinegar Polishing Modernization
Portfolio financial architecture — Wine Clarification and Vinegar Polishing Modernization: workstream detailed-project value. Separate financial basis; not additive to the total employer portfolio.
Historical/reference value · Existing-project value
Workstream Existing-Project Value · 3,133,000 USD ↗
Applies to: Wine Clarification and Vinegar Polishing Modernization
Portfolio financial architecture — Wine Clarification and Vinegar Polishing Modernization: workstream existing-project value. Separate financial basis; not additive to the total employer portfolio.
Historical/reference value · Portfolio inventory value
Portfolio Capital Value · 5,300,000 USD
Applies to: Lines 1 & 2 Bottling and Packaging Lines
Workstream inventory — Capital value for lines 1 & 2 Bottling and Packaging Lines.
Historical/reference value · Portfolio inventory value
Portfolio Capital Value · 5,300,000 USD
Applies to: Lines 1 & 2 Bottling and Packaging Lines
Workstream inventory — Capital value for lines 1 & 2 Bottling and Packaging Lines.
Historical/reference value · Portfolio inventory value
Portfolio Capital Value · 5,300,000 USD
Applies to: Lines 1 & 2 Bottling and Packaging Lines
Workstream inventory — Capital value for lines 1 & 2 Bottling and Packaging Lines.
Historical/reference value · Portfolio inventory value
Portfolio Capital Value · 5,301,000 USD
Applies to: Lines 1 & 2 Bottling and Packaging Lines
Workstream inventory — Capital value for lines 1 & 2 Bottling and Packaging Lines.
Historical/reference value · Portfolio inventory value
Portfolio Capital Value · 6,100,000 USD
Applies to: Acetator Expansion Project + VOC Scrubber Systems
Workstream inventory — Capital value for acetator Expansion Project + VOC Scrubber Systems.
Historical/reference value · Portfolio inventory value
Portfolio Capital Value · 6,101,000 USD
Applies to: Acetator Expansion Project + VOC Scrubber Systems
Workstream inventory — Capital value for acetator Expansion Project + VOC Scrubber Systems.
Historical/reference value · Portfolio inventory value
Portfolio Capital Value · 6,102,000 USD
Applies to: Acetator Expansion Project + VOC Scrubber Systems
Workstream inventory — Capital value for acetator Expansion Project + VOC Scrubber Systems.
Historical/reference value · Portfolio inventory value
Portfolio Capital Value · 6,103,000 USD
Applies to: Acetator Expansion Project + VOC Scrubber Systems
Workstream inventory — Capital value for acetator Expansion Project + VOC Scrubber Systems.
Historical/reference value · Portfolio inventory value
Portfolio Capital Value · 6,104,000 USD
Applies to: Acetator Expansion Project + VOC Scrubber Systems
Workstream inventory — Capital value for acetator Expansion Project + VOC Scrubber Systems.
Historical/reference value · Portfolio inventory value
Portfolio Capital Value · 6,105,000 USD
Applies to: Acetator Expansion Project + VOC Scrubber Systems
Workstream inventory — Capital value for acetator Expansion Project + VOC Scrubber Systems.
Historical/reference value · Portfolio inventory value
Portfolio Capital Value · 6,106,000 USD
Applies to: Acetator Expansion Project + VOC Scrubber Systems
Workstream inventory — Capital value for acetator Expansion Project + VOC Scrubber Systems.
Historical/reference value · Portfolio inventory value
Portfolio Capital Value · 6,107,000 USD
Applies to: Acetator Expansion Project + VOC Scrubber Systems
Workstream inventory — Capital value for acetator Expansion Project + VOC Scrubber Systems.
Historical/reference value · Portfolio inventory value
Portfolio Capital Value · 1,101,000 USD
Applies to: Ceramic Crossflow Filter System + Ion Exchange Trial
Workstream inventory — Capital value for ceramic Crossflow Filter System + Ion Exchange Trial.
Historical/reference value · Portfolio inventory value
Portfolio Capital Value · 1,102,000 USD
Applies to: Ceramic Crossflow Filter System + Ion Exchange Trial
Workstream inventory — Capital value for ceramic Crossflow Filter System + Ion Exchange Trial.
Historical/reference value · Portfolio inventory value
Portfolio Capital Value · 1,103,000 USD
Applies to: Ceramic Crossflow Filter System + Ion Exchange Trial
Workstream inventory — Capital value for ceramic Crossflow Filter System + Ion Exchange Trial.
Historical/reference value · Portfolio inventory value
Portfolio Capital Value · 1,104,000 USD
Applies to: Ceramic Crossflow Filter System + Ion Exchange Trial
Workstream inventory — Capital value for ceramic Crossflow Filter System + Ion Exchange Trial.
Historical/reference value · Portfolio inventory value
Portfolio Capital Value · 1,105,000 USD
Applies to: Ceramic Crossflow Filter System + Ion Exchange Trial
Workstream inventory — Capital value for ceramic Crossflow Filter System + Ion Exchange Trial.
Historical/reference value · Portfolio inventory value
Portfolio Capital Value · 1,106,000 USD
Applies to: Ceramic Crossflow Filter System + Ion Exchange Trial
Workstream inventory — Capital value for ceramic Crossflow Filter System + Ion Exchange Trial.
Historical/reference value · Portfolio inventory value
Portfolio Capital Value · 1,108,000 USD
Applies to: Ceramic Crossflow Filter System + Ion Exchange Trial
Workstream inventory — Capital value for ceramic Crossflow Filter System + Ion Exchange Trial.
Historical/reference value · Portfolio inventory value
Portfolio Capital Value · 1,109,000 USD
Applies to: Ceramic Crossflow Filter System + Ion Exchange Trial
Workstream inventory — Capital value for ceramic Crossflow Filter System + Ion Exchange Trial.
Historical/reference value · Portfolio inventory value
Portfolio Capital Value · 1,110,000 USD
Applies to: Ceramic Crossflow Filter System + Ion Exchange Trial
Workstream inventory — Capital value for ceramic Crossflow Filter System + Ion Exchange Trial.
Historical/reference value · Portfolio inventory value
Portfolio Capital Value · 1,111,000 USD
Applies to: Ceramic Crossflow Filter System + Ion Exchange Trial
Workstream inventory — Capital value for ceramic Crossflow Filter System + Ion Exchange Trial.
Historical/reference value · Portfolio inventory value
Portfolio Capital Value · 370,000 USD
Applies to: Winery Centrifuge Filtration
Workstream inventory — Capital value for winery Centrifuge Filtration.
Historical/reference value · Portfolio inventory value
Portfolio Capital Value · 371,000 USD
Applies to: Winery Centrifuge Filtration
Workstream inventory — Capital value for winery Centrifuge Filtration.
Historical/reference value · Portfolio inventory value
Portfolio Capital Value · 372,000 USD
Applies to: Winery Centrifuge Filtration
Workstream inventory — Capital value for winery Centrifuge Filtration.
Historical/reference value · Portfolio inventory value
Portfolio Capital Value · 373,000 USD
Applies to: Winery Centrifuge Filtration
Workstream inventory — Capital value for winery Centrifuge Filtration.
Historical/reference value · Portfolio inventory value
Portfolio Capital Value · 374,000 USD
Applies to: Winery Centrifuge Filtration
Workstream inventory — Capital value for winery Centrifuge Filtration.
Historical/reference value · Portfolio inventory value
Portfolio Capital Value · 375,000 USD
Applies to: Winery Centrifuge Filtration
Workstream inventory — Capital value for winery Centrifuge Filtration.
Historical/reference value · Portfolio inventory value
Portfolio Capital Value · 376,000 USD
Applies to: Winery Centrifuge Filtration
Workstream inventory — Capital value for winery Centrifuge Filtration.
Historical/reference value · Portfolio inventory value
Portfolio Capital Value · 380,000 USD
Applies to: Winery Centrifuge Filtration
Workstream inventory — Capital value for winery Centrifuge Filtration.
Historical/reference value · Portfolio inventory value
Portfolio Capital Value · 377,000 USD
Applies to: Winery Centrifuge Filtration
Workstream inventory — Capital value for winery Centrifuge Filtration.
Historical/reference value · Portfolio inventory value
Portfolio Capital Value · 378,000 USD
Applies to: Winery Centrifuge Filtration
Workstream inventory — Capital value for winery Centrifuge Filtration.
Historical/reference value · Portfolio inventory value
Portfolio Capital Value · 379,000 USD
Applies to: Winery Centrifuge Filtration
Workstream inventory — Capital value for winery Centrifuge Filtration.
Historical/reference value · Portfolio inventory value
Portfolio Capital Value · 501,000 USD
Applies to: Electrical Infrastructure Modernization
Workstream inventory — Capital value for electrical Infrastructure Modernization.
Historical/reference value · Portfolio inventory value
Portfolio Capital Value · 502,000 USD
Applies to: Electrical Infrastructure Modernization
Workstream inventory — Capital value for electrical Infrastructure Modernization.
Historical/reference value · Portfolio inventory value
Portfolio Capital Value · 503,000 USD
Applies to: Electrical Infrastructure Modernization
Workstream inventory — Capital value for electrical Infrastructure Modernization.
Historical/reference value · Portfolio inventory value
Portfolio Capital Value · 504,000 USD
Applies to: Electrical Infrastructure Modernization
Workstream inventory — Capital value for electrical Infrastructure Modernization.
Historical/reference value · Portfolio inventory value
Portfolio Capital Value · 505,000 USD
Applies to: Electrical Infrastructure Modernization
Workstream inventory — Capital value for electrical Infrastructure Modernization.
Historical/reference value · Portfolio inventory value
Portfolio Capital Value · 506,000 USD
Applies to: Electrical Infrastructure Modernization
Workstream inventory — Capital value for electrical Infrastructure Modernization.
Historical/reference value · Portfolio inventory value
Portfolio Capital Value · 507,000 USD
Applies to: Electrical Infrastructure Modernization
Workstream inventory — Capital value for electrical Infrastructure Modernization.
Historical/reference value · Portfolio inventory value
Portfolio Capital Value · 508,000 USD
Applies to: Electrical Infrastructure Modernization
Workstream inventory — Capital value for electrical Infrastructure Modernization.
Historical/reference value · Portfolio inventory value
Portfolio Capital Value · 509,000 USD
Applies to: Electrical Infrastructure Modernization
Workstream inventory — Capital value for electrical Infrastructure Modernization.
Historical/reference value · Portfolio inventory value
Portfolio Capital Value · 510,000 USD
Applies to: Electrical Infrastructure Modernization
Workstream inventory — Capital value for electrical Infrastructure Modernization.
Historical/reference value · Portfolio inventory value
Portfolio Capital Value · 1,450,000 USD
Applies to: Boiler System + Plant Steam & Condensate Optimization
Workstream inventory — Capital value for boiler System + Plant Steam & Condensate Optimization.
Historical/reference value · Portfolio inventory value
Portfolio Capital Value · 1,451,000 USD
Applies to: Boiler System + Plant Steam & Condensate Optimization
Workstream inventory — Capital value for boiler System + Plant Steam & Condensate Optimization.
Historical/reference value · Portfolio inventory value
Portfolio Capital Value · 1,452,000 USD
Applies to: Boiler System + Plant Steam & Condensate Optimization
Workstream inventory — Capital value for boiler System + Plant Steam & Condensate Optimization.
Historical/reference value · Portfolio inventory value
Portfolio Capital Value · 1,453,000 USD
Applies to: Boiler System + Plant Steam & Condensate Optimization
Workstream inventory — Capital value for boiler System + Plant Steam & Condensate Optimization.
Historical/reference value · Portfolio inventory value
Portfolio Capital Value · 1,454,000 USD
Applies to: Boiler System + Plant Steam & Condensate Optimization
Workstream inventory — Capital value for boiler System + Plant Steam & Condensate Optimization.
Historical/reference value · Portfolio inventory value
Portfolio Capital Value · 1,455,000 USD
Applies to: Boiler System + Plant Steam & Condensate Optimization
Workstream inventory — Capital value for boiler System + Plant Steam & Condensate Optimization.
Historical/reference value · Portfolio inventory value
Portfolio Capital Value · 1,456,000 USD
Applies to: Boiler System + Plant Steam & Condensate Optimization
Workstream inventory — Capital value for boiler System + Plant Steam & Condensate Optimization.
Historical/reference value · Portfolio inventory value
Portfolio Capital Value · 1,457,000 USD
Applies to: Boiler System + Plant Steam & Condensate Optimization
Workstream inventory — Capital value for boiler System + Plant Steam & Condensate Optimization.
Historical/reference value · Portfolio inventory value
Portfolio Capital Value · 1,458,000 USD
Applies to: Boiler System + Plant Steam & Condensate Optimization
Workstream inventory — Capital value for boiler System + Plant Steam & Condensate Optimization.
Historical/reference value · Portfolio inventory value
Portfolio Capital Value · 1,459,000 USD
Applies to: Boiler System + Plant Steam & Condensate Optimization
Workstream inventory — Capital value for boiler System + Plant Steam & Condensate Optimization.
Historical/reference value · Portfolio inventory value
Portfolio Capital Value · 1,200,000 USD
Applies to: Cooling Tower, Chiller Circuit, and Injection Well Retrofit
Workstream inventory — Capital value for cooling Tower, Chiller Circuit, and Injection Well Retrofit.
Historical/reference value · Portfolio inventory value
Portfolio Capital Value · 1,202,000 USD
Applies to: Cooling Tower, Chiller Circuit, and Injection Well Retrofit
Workstream inventory — Capital value for cooling Tower, Chiller Circuit, and Injection Well Retrofit.
Historical/reference value · Portfolio inventory value
Portfolio Capital Value · 1,204,000 USD
Applies to: Cooling Tower, Chiller Circuit, and Injection Well Retrofit
Workstream inventory — Capital value for cooling Tower, Chiller Circuit, and Injection Well Retrofit.
Historical/reference value · Portfolio inventory value
Portfolio Capital Value · 1,201,000 USD
Applies to: Cooling Tower, Chiller Circuit, and Injection Well Retrofit
Workstream inventory — Capital value for cooling Tower, Chiller Circuit, and Injection Well Retrofit.
Historical/reference value · Portfolio inventory value
Portfolio Capital Value · 1,203,000 USD
Applies to: Cooling Tower, Chiller Circuit, and Injection Well Retrofit
Workstream inventory — Capital value for cooling Tower, Chiller Circuit, and Injection Well Retrofit.
Historical/reference value · Portfolio inventory value
Portfolio Capital Value · 1,205,000 USD
Applies to: Cooling Tower, Chiller Circuit, and Injection Well Retrofit
Workstream inventory — Capital value for cooling Tower, Chiller Circuit, and Injection Well Retrofit.
Historical/reference value · Portfolio inventory value
Portfolio Capital Value · 1,300,000 USD
Applies to: Production-cooling upgrade with three 160-ton chillers
Workstream inventory — Capital value for production-cooling upgrade with three 160-ton chillers.
Historical/reference value · Portfolio inventory value
Portfolio Capital Value · 1,301,000 USD
Applies to: Production-cooling upgrade with three 160-ton chillers
Workstream inventory — Capital value for production-cooling upgrade with three 160-ton chillers.
Historical/reference value · Portfolio inventory value
Portfolio Capital Value · 1,301,000 USD
Applies to: Production-cooling upgrade with three 160-ton chillers
Workstream inventory — Capital value for production-cooling upgrade with three 160-ton chillers.
Historical/reference value · Portfolio inventory value
Portfolio Capital Value · 150,000 USD
Applies to: Fermenter & Acetator Cooling Alarm System
Workstream inventory — Capital value for fermenter & Acetator Cooling Alarm System.
Historical/reference value · Portfolio inventory value
Portfolio Capital Value · 150,000 USD
Applies to: Fermenter & Acetator Cooling Alarm System
Workstream inventory — Capital value for fermenter & Acetator Cooling Alarm System.
Historical/reference value · Portfolio inventory value
Portfolio Capital Value · 150,000 USD
Applies to: Fermenter & Acetator Cooling Alarm System
Workstream inventory — Capital value for fermenter & Acetator Cooling Alarm System.
Historical/reference value · Portfolio inventory value
Portfolio Capital Value · 150,000 USD
Applies to: Fermenter & Acetator Cooling Alarm System
Workstream inventory — Capital value for fermenter & Acetator Cooling Alarm System.
Historical/reference value · Portfolio inventory value
Portfolio Capital Value · 900,000 USD
Applies to: Line 1 Capper and Conveyor Upgrade + Bulk Nitrogen Transition
Workstream inventory — Capital value for line 1 Capper and Conveyor Upgrade + Bulk Nitrogen Transition.
Historical/reference value · Portfolio inventory value
Portfolio Capital Value · 225,000 USD
Applies to: Nitrogen Dosing, Automated Microbulk Refill Station + Storage Tank Conversion
Workstream inventory — Capital value for nitrogen Dosing, Automated Microbulk Refill Station+ Storage Tank Conversion.
Historical/reference value · Portfolio inventory value
Portfolio Capital Value · 250,000 USD
Applies to: Fiberoptic OT Network
Workstream inventory — Capital value for fiberoptic OT Network.
Historical/reference value · Portfolio inventory value
Portfolio Capital Value · 251,000 USD
Applies to: Fiberoptic OT Network
Workstream inventory — Capital value for fiberoptic OT Network.
Historical/reference value · Portfolio inventory value
Portfolio Capital Value · 252,000 USD
Applies to: Fiberoptic OT Network
Workstream inventory — Capital value for fiberoptic OT Network.
Historical/reference value · Portfolio inventory value
Portfolio Capital Value · 253,000 USD
Applies to: Fiberoptic OT Network
Workstream inventory — Capital value for fiberoptic OT Network.
Historical/reference value · Portfolio inventory value
Portfolio Capital Value · 254,000 USD
Applies to: Fiberoptic OT Network
Workstream inventory — Capital value for fiberoptic OT Network.
Historical/reference value · Portfolio inventory value
Portfolio Capital Value · 255,000 USD
Applies to: Fiberoptic OT Network
Workstream inventory — Capital value for fiberoptic OT Network.
Historical/reference value · Portfolio inventory value
Portfolio Capital Value · 256,000 USD
Applies to: Fiberoptic OT Network
Workstream inventory — Capital value for fiberoptic OT Network.
Historical/reference value · Portfolio inventory value
Portfolio Capital Value · 257,000 USD
Applies to: Fiberoptic OT Network
Workstream inventory — Capital value for fiberoptic OT Network.
Historical/reference value · Portfolio inventory value
Portfolio Capital Value · 258,000 USD
Applies to: Fiberoptic OT Network
Workstream inventory — Capital value for fiberoptic OT Network.
Historical/reference value · Portfolio inventory value
Portfolio Capital Value · 259,000 USD
Applies to: Fiberoptic OT Network
Workstream inventory — Capital value for fiberoptic OT Network.
Historical/reference value · Portfolio inventory value
Portfolio Capital Value · 260,000 USD
Applies to: Fiberoptic OT Network
Workstream inventory — Capital value for fiberoptic OT Network.
Historical/reference value · Portfolio inventory value
Portfolio Capital Value · 153,000 USD
Applies to: Tank Measurement Project standardization
Workstream inventory — Capital value for tank Measurement Project standardization.
Historical/reference value · Portfolio inventory value
Portfolio Capital Value · 148,000 USD
Applies to: Tank-level measurement standards and procurement alignment
Workstream inventory — Capital value for tank Level Measurement System Standardization.
Historical/reference value · Portfolio inventory value
Portfolio Capital Value · 161,000 USD
Applies to: Tank-measurement standards for future upgrades
Workstream inventory — Capital value for tank Measurement System Standardization.
Historical/reference value · Portfolio inventory value
Portfolio Capital Value · 167,000 USD
Applies to: Tank-level monitoring and field-access planning
Workstream inventory — Capital value for tank Level Monitoring Standardization.
Historical/reference value · Portfolio inventory value
Portfolio Capital Value · 500,000 USD
Applies to: Drainage and erosion-control project overview
Workstream inventory — Capital value for site Enhancements, Drainage Erosion Mitigation, and Runoff Controls.
Historical/reference value · Portfolio inventory value
Portfolio Capital Value · 501,000 USD
Applies to: Drainage and erosion-control project overview
Workstream inventory — Capital value for site Enhancements, Drainage Erosion Mitigation, and Runoff Controls.
Historical/reference value · Portfolio inventory value
Portfolio Capital Value · 502,000 USD
Applies to: Drainage and erosion-control project overview
Workstream inventory — Capital value for site Enhancements, Drainage Erosion Mitigation, and Runoff Controls.
Historical/reference value · Portfolio inventory value
Portfolio Capital Value · 503,000 USD
Applies to: Drainage and erosion-control project overview
Workstream inventory — Capital value for site Enhancements, Drainage Erosion Mitigation, and Runoff Controls.
Historical/reference value · Portfolio inventory value
Portfolio Capital Value · 504,000 USD
Applies to: Drainage and erosion-control project overview
Workstream inventory — Capital value for site Enhancements, Drainage Erosion Mitigation, and Runoff Controls.
Historical/reference value · Portfolio inventory value
Portfolio Capital Value · 505,000 USD
Applies to: Drainage and erosion-control project overview
Workstream inventory — Capital value for site Enhancements, Drainage Erosion Mitigation, and Runoff Controls.
Historical/reference value · Portfolio inventory value
Portfolio Capital Value · 506,000 USD
Applies to: Drainage and erosion-control project overview
Workstream inventory — Capital value for site Enhancements, Drainage Erosion Mitigation, and Runoff Controls.
Historical/reference value · Portfolio inventory value
Portfolio Capital Value · 507,000 USD
Applies to: Drainage and erosion-control project overview
Workstream inventory — Capital value for site Enhancements, Drainage Erosion Mitigation, and Runoff Controls.
Historical/reference value · Portfolio inventory value
Portfolio Capital Value · 508,000 USD
Applies to: Drainage and erosion-control project overview
Workstream inventory — Capital value for site Enhancements, Drainage Erosion Mitigation, and Runoff Controls.
Historical/reference value · Portfolio inventory value
Portfolio Capital Value · 509,000 USD
Applies to: Drainage and erosion-control project overview
Workstream inventory — Capital value for site Enhancements, Drainage Erosion Mitigation, and Runoff Controls.
Historical/reference value · Operating-profile reference
PRV Operating-Pressure Range · 20 to 100 psi ↗
Applies to: Reduction Steam Delivery Manifold Redesign and PRV Optimization
Steam and condensate study — Operating range considered in the PRV and jacket-supply study.
Historical/reference value · Operating-profile reference
Batch Duration for Steam-Pressure Profile · 2 Day ↗
Applies to: Reduction Steam Delivery Manifold Redesign and PRV Optimization
Steam and condensate study — Batch duration for the initial heating and lower-pressure holding stages.
Baseline · Prior equipment condition
Prior Condensate Return Diameter · 3 in ↗
Applies to: Reduction Steam Delivery Manifold Redesign and PRV Optimization
Steam and condensate study — Diameter of the condensate return discussed in prior upgrade lessons.
Historical/reference value · Prior upgrade reference
Replacement Condensate Return Diameter · 0.5 to 1 in ↗
Applies to: Reduction Steam Delivery Manifold Redesign and PRV Optimization
Steam and condensate study — Smaller condensate-return sizes considered with 1–2 HP pumps.
Design parameter · Design input
Centrifuge Process-Line Diameter · 3 in ↗
Applies to: Wine Clarification and Vinegar Polishing Modernization
Centrifuge pipeline evaluation — Nominal diameter used for both the stainless run and the downstream Schedule 80 PVC segment.
Design parameter · Design input
Evaluated Process-Line Length · Approximately 280 ft ↗
Applies to: Wine Clarification and Vinegar Polishing Modernization
Centrifuge pipeline evaluation — Approximate total run considered with elevation and fitting losses.
Target · Design target
Centrifuge Pipeline Flow Target · 44 GPM ↗
Applies to: Wine Clarification and Vinegar Polishing Modernization
Centrifuge pipeline evaluation — Flow target used in the piping and open-tank-discharge evaluation.
Design parameter · Design input
Centrifuge Pipeline Counterpressure Range · 2 to 4 Bar ↗
Applies to: Wine Clarification and Vinegar Polishing Modernization
Centrifuge pipeline evaluation — Counterpressure interval used for the pipeline evaluation.
Scope or inventory quantity · Planned quantity
Later Green-Space Restoration Area · 7,500 to 10,000 Sq ft ↗
Applies to: Site Enhancement Initiative
Later site-restoration concept — Later restoration concept area, separate from the earlier curb and sod scope.
Scope or inventory quantity · Planned quantity
Later Restoration Bush Quantity · Approximately 230 Bushes ↗
Applies to: Site Enhancement Initiative
Later site-restoration concept — Approximate bush quantity in the later restoration concept.
Target · Planned support
Water-Truck Support Frequency · 2 Visits/Week ↗
Applies to: Site Enhancement Initiative
Later site-restoration concept — Watering-support frequency for the later green-space concept.
Target · Planned support
Water-Truck Support Duration · 4 Months ↗
Applies to: Site Enhancement Initiative
Later site-restoration concept — Planned watering-support period for the later green-space concept.
Design parameter · Specified configuration
Controls-Panel DC Supply · 24 VDC ↗
Applies to: Used AI to develop electrical/panel/network BOM comparisons, VFD and motor references, instrument-integration questions and PLC/HMI commissioning considerations
controls specification — Control-power level specified for panel and network support.
Target · Acceptance criterion
Injection-Well Acceptance Flow · 25 to 50 GPM ↗
Applies to: Cooling Tower, Chiller Circuit, and Injection Well Retrofit
Primary-site acceptance test — Minimum cooling-water flow the new primary-site injection well was to accept under the authorization acceptance criteria.
No matching entries. Try another term.