CASE-020 · Engineering case

Ceramic Filtration Cost-per-Gallon and NPV Model

Built the capital case by comparing ceramic crossflow with continued replacement of legacy filtration components and recurring media costs.

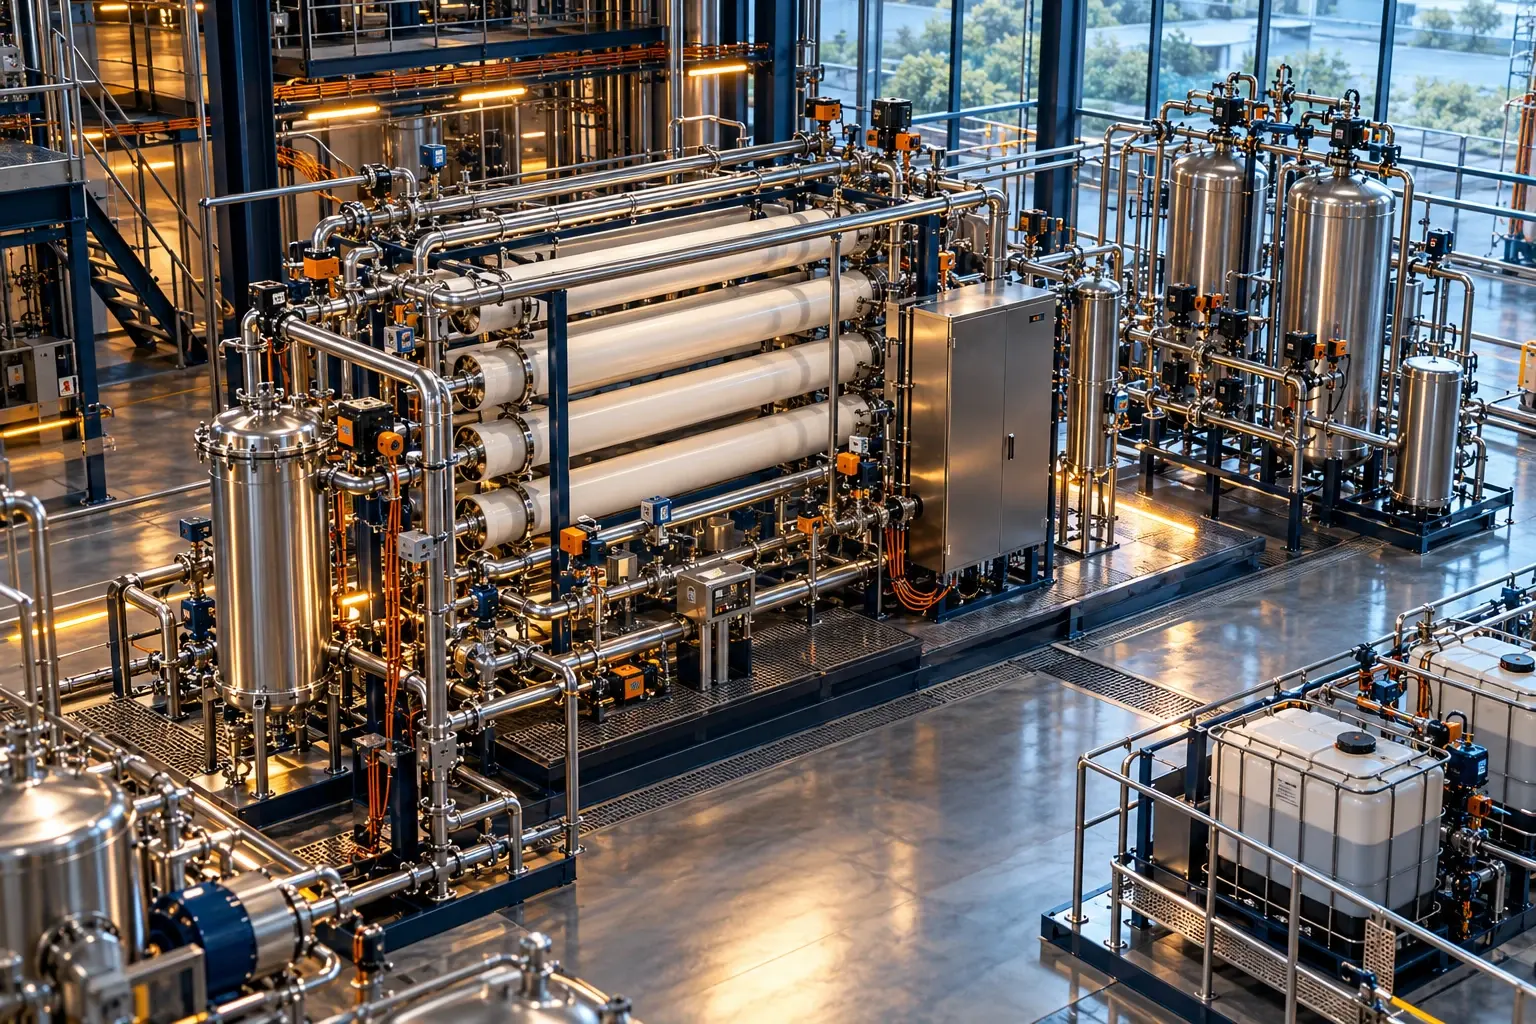
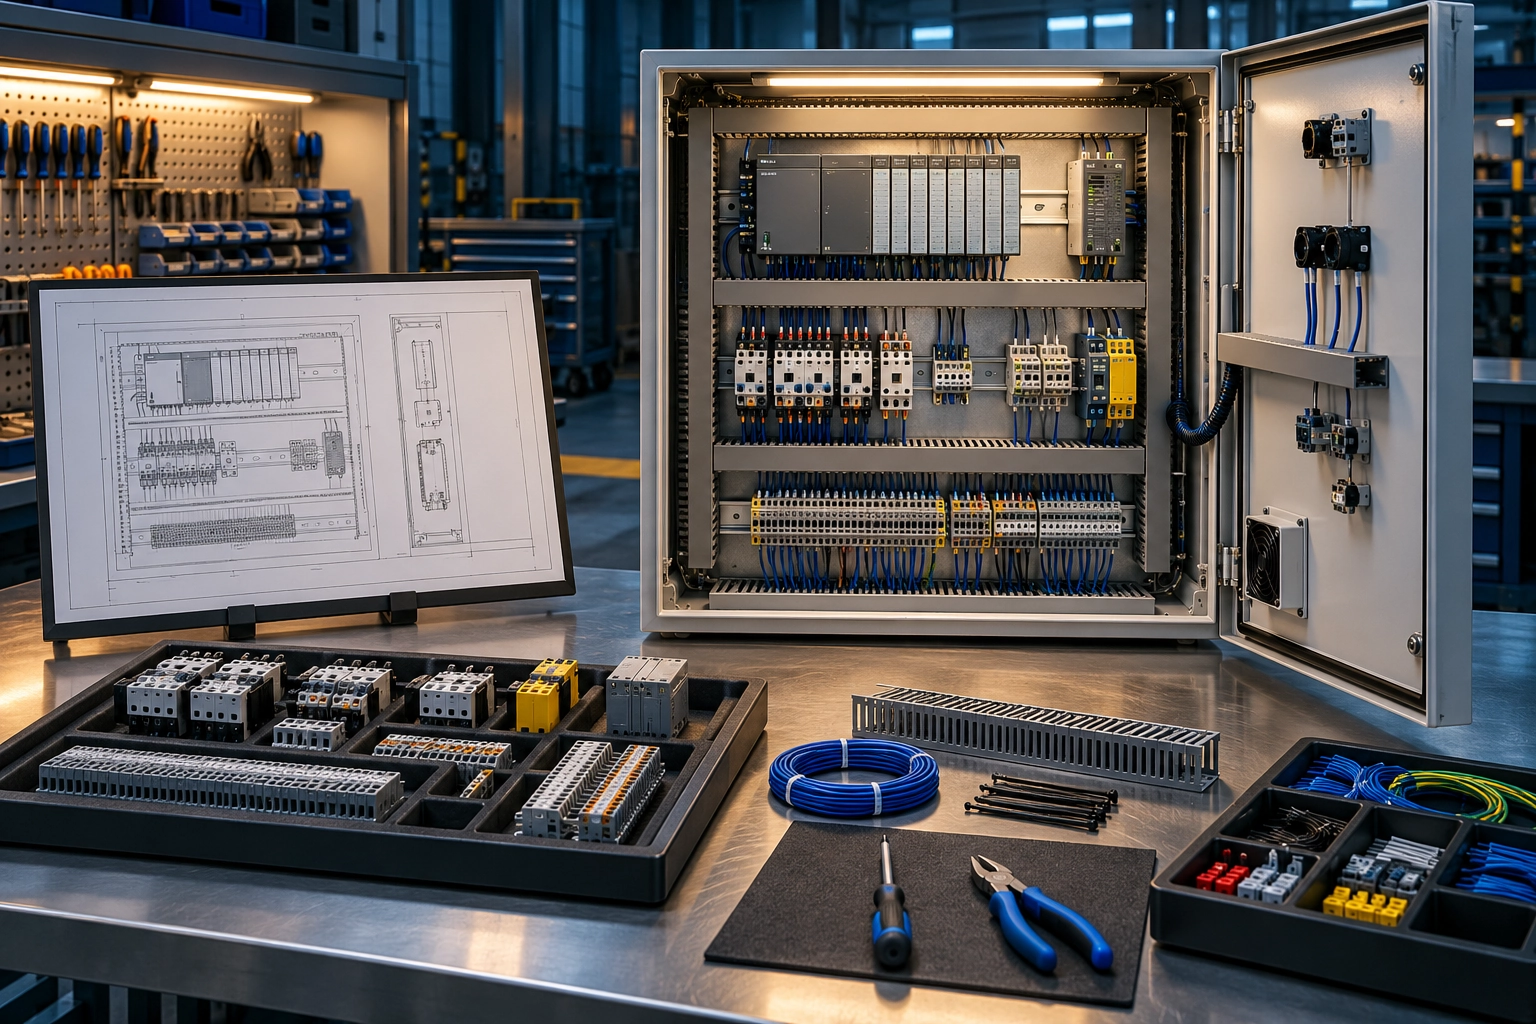
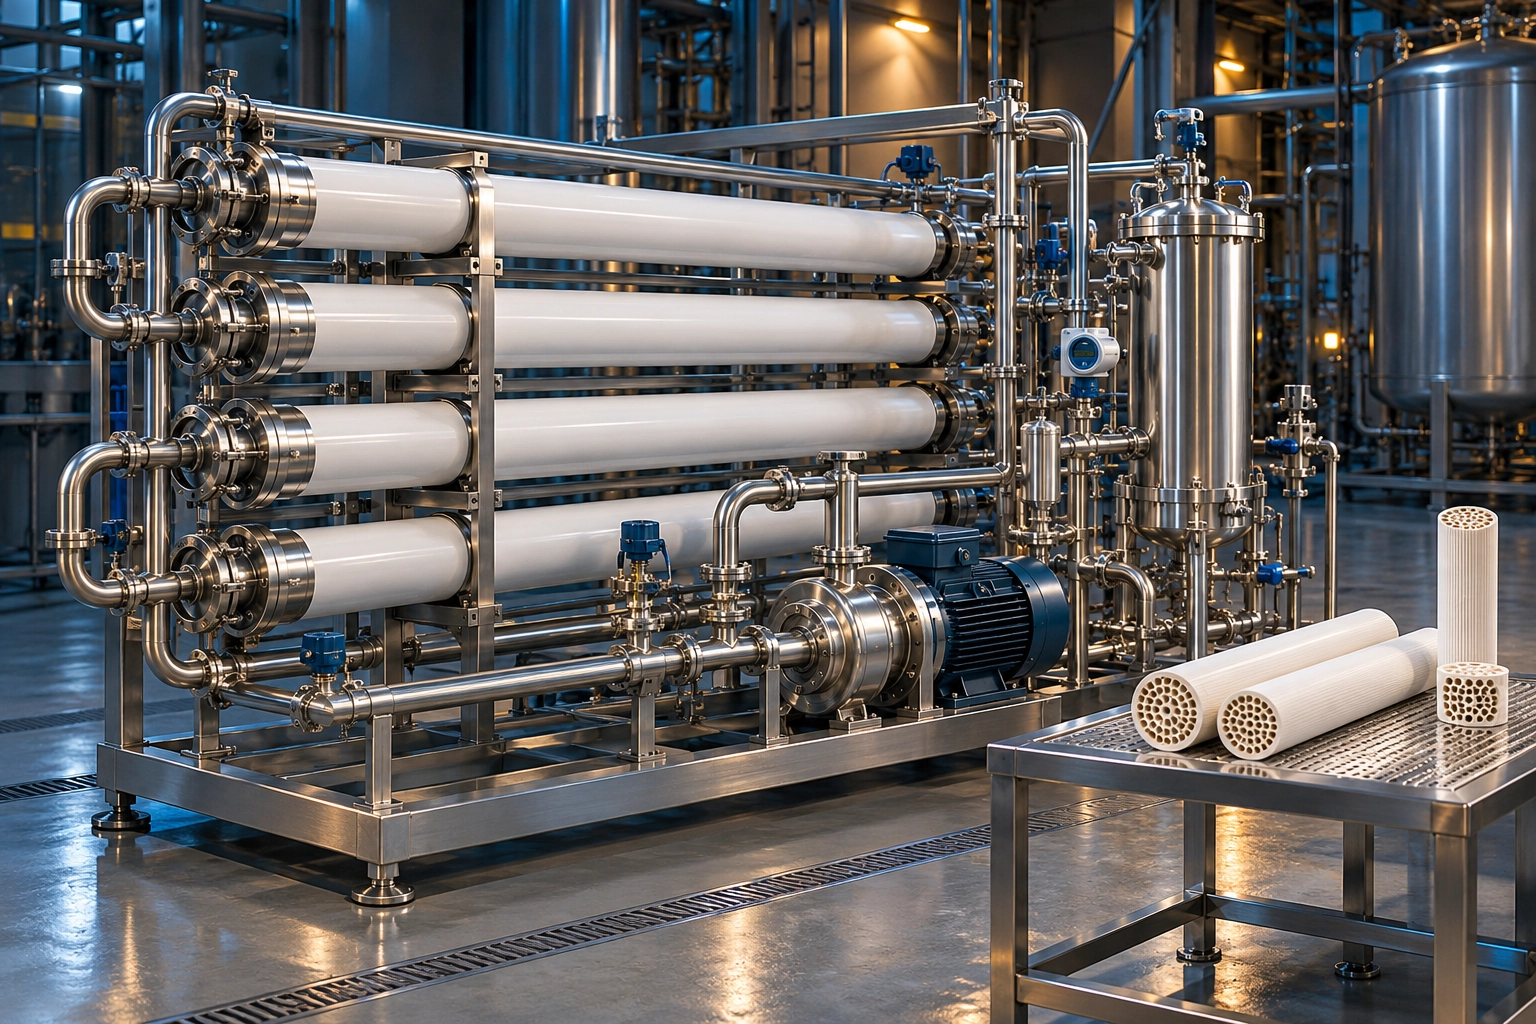
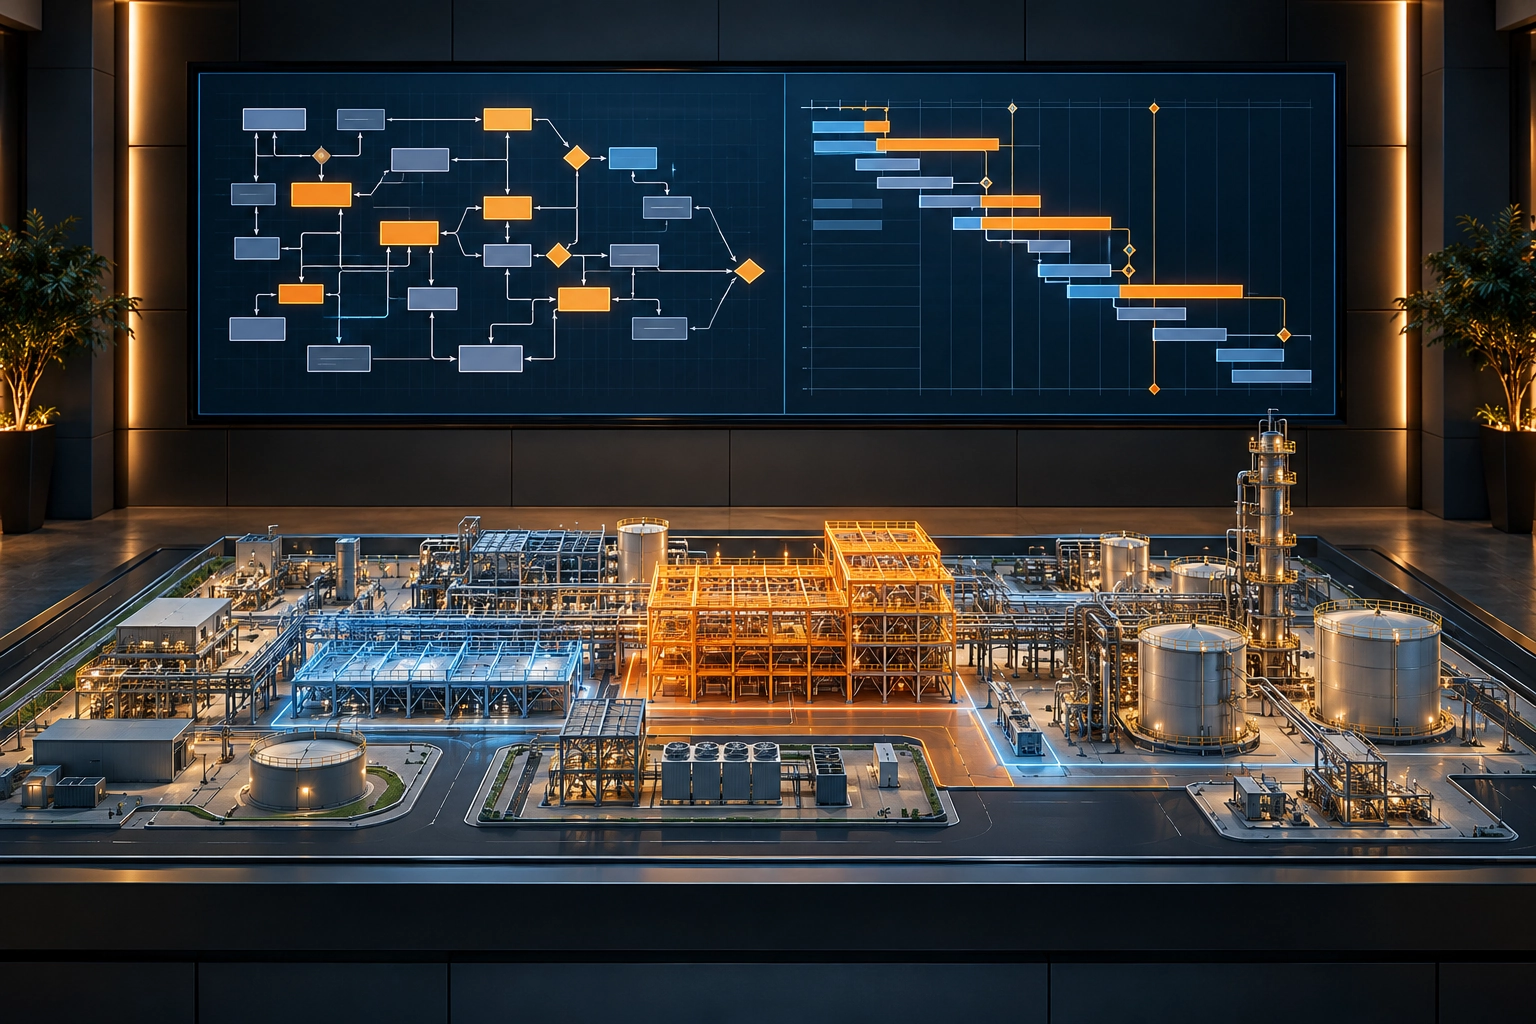
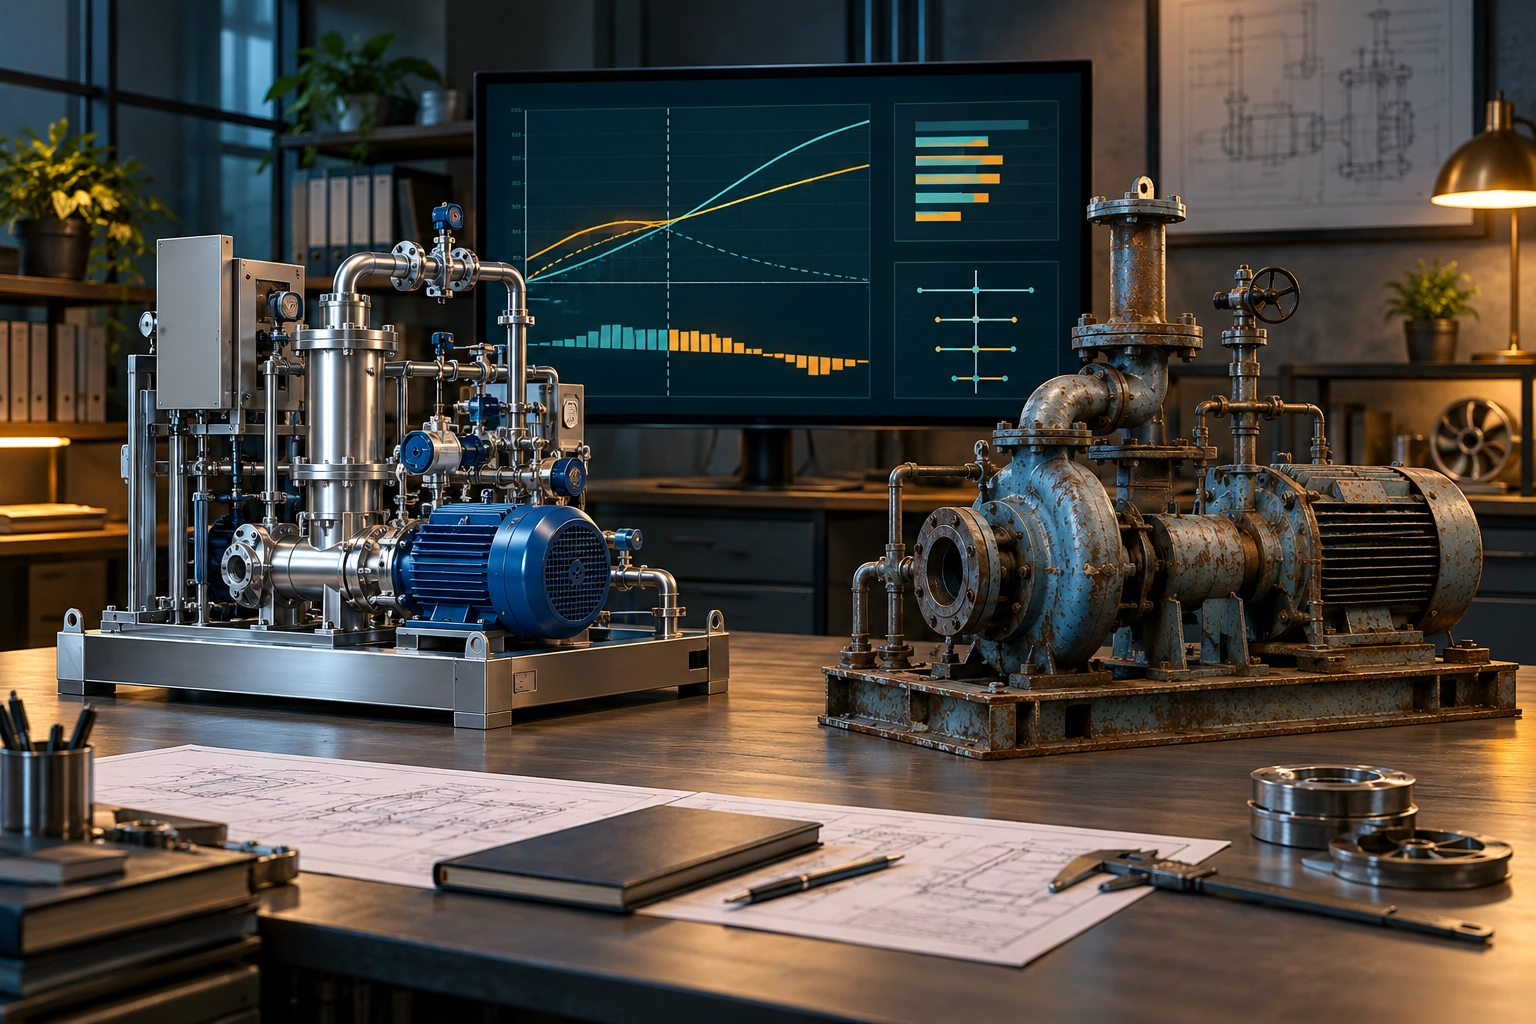
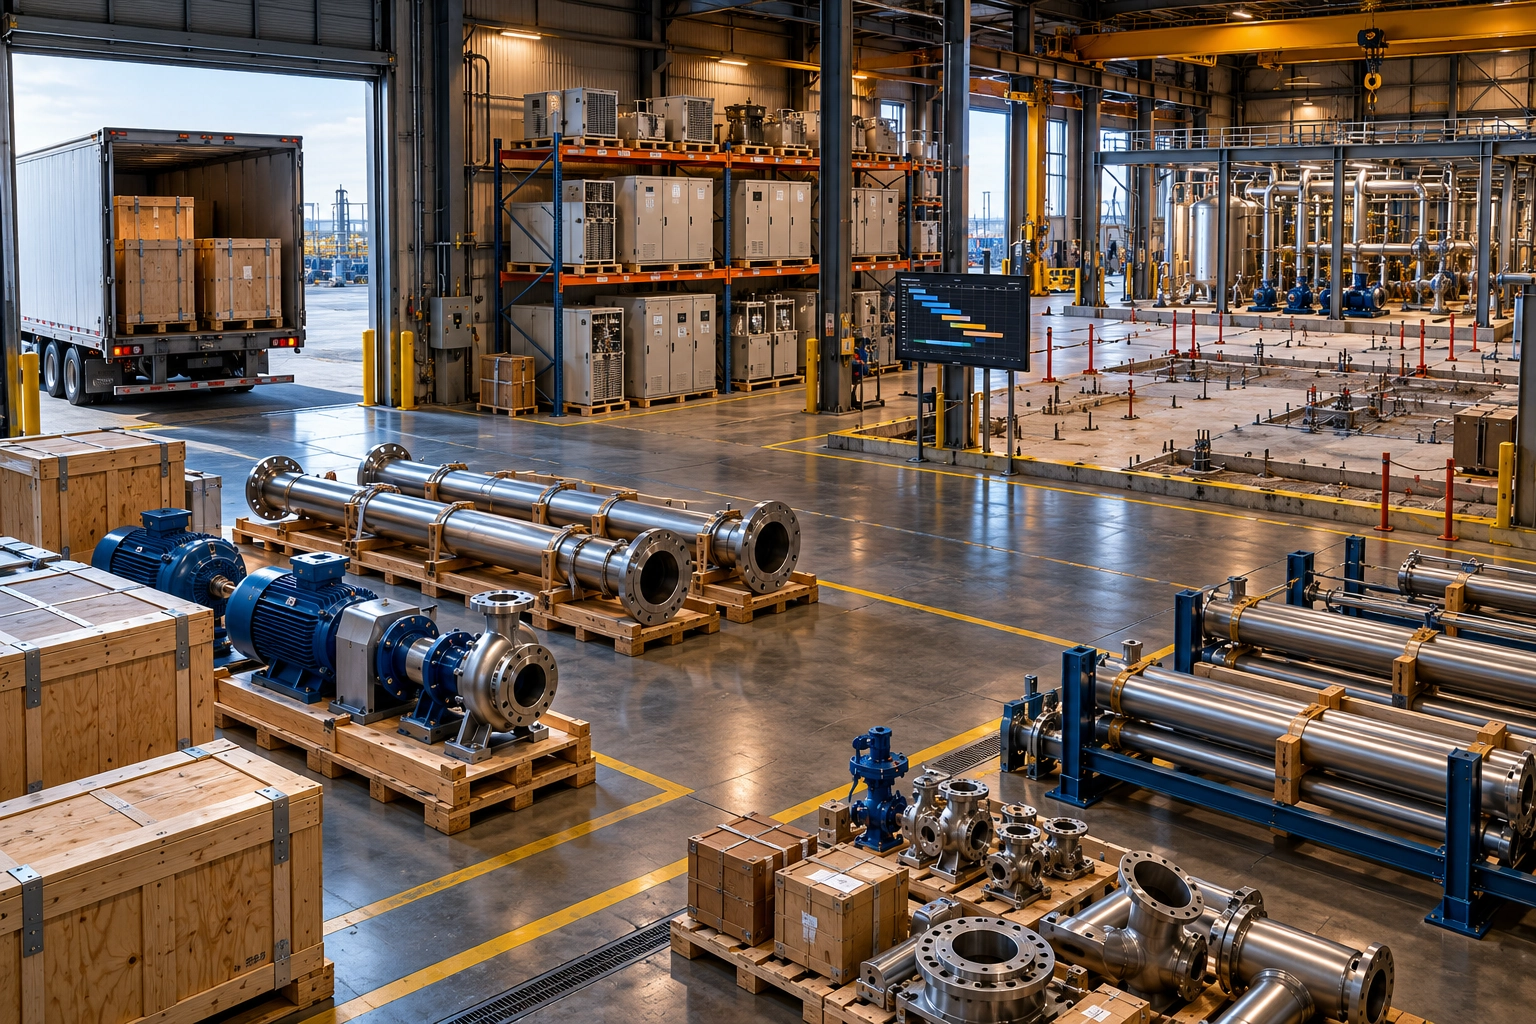
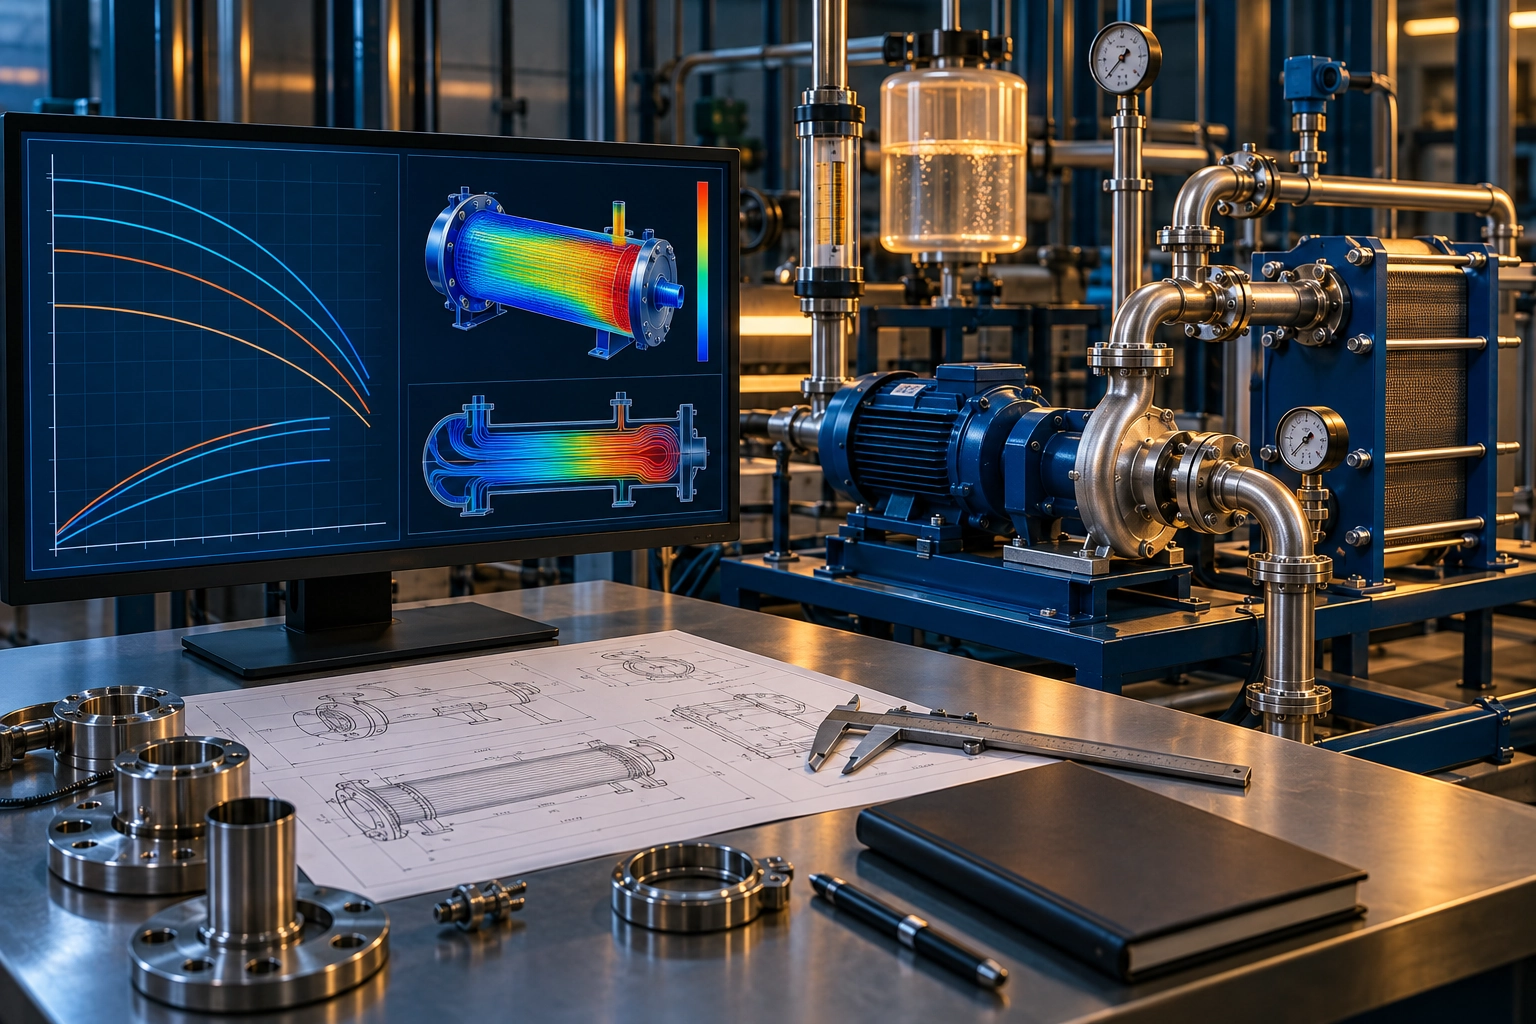
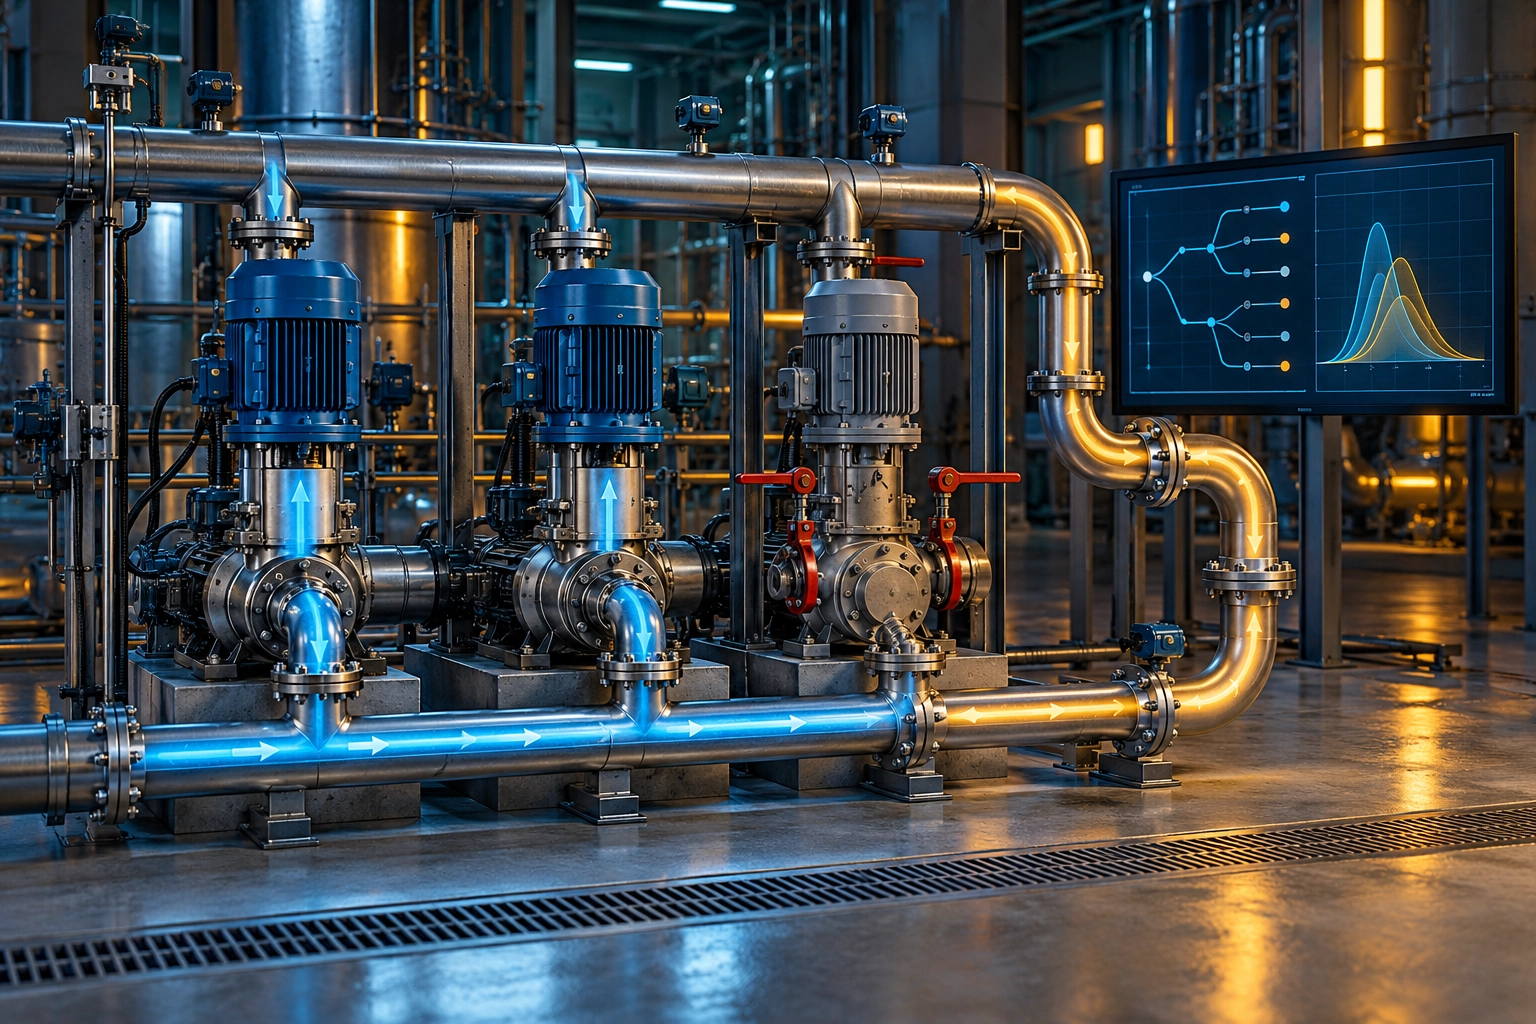
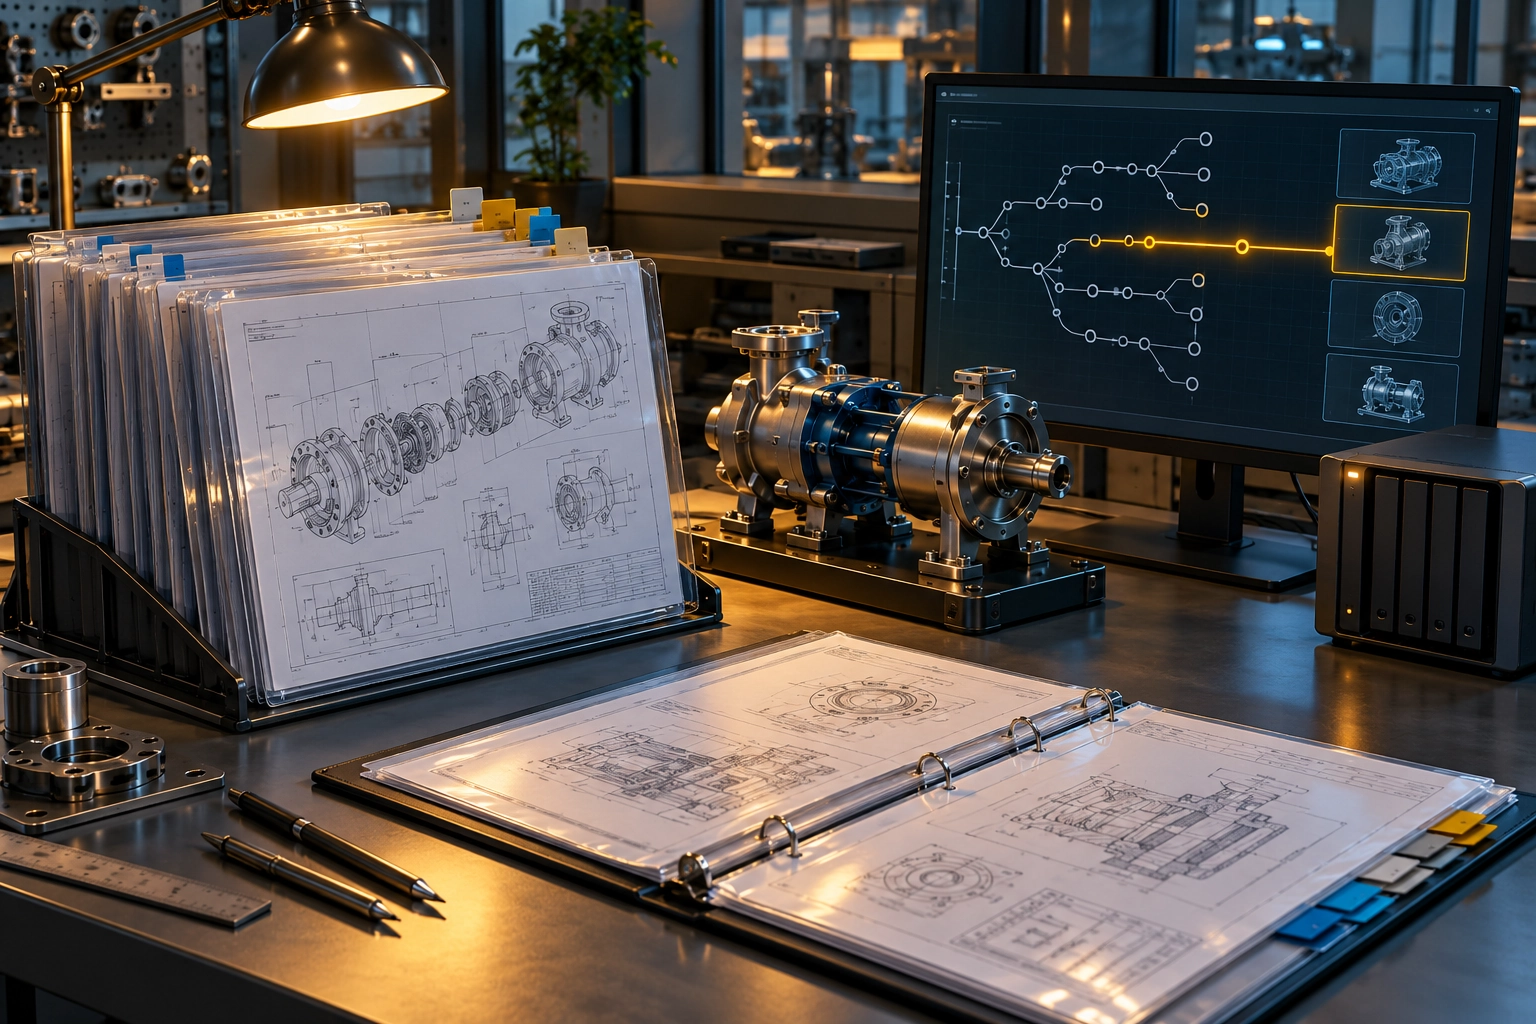
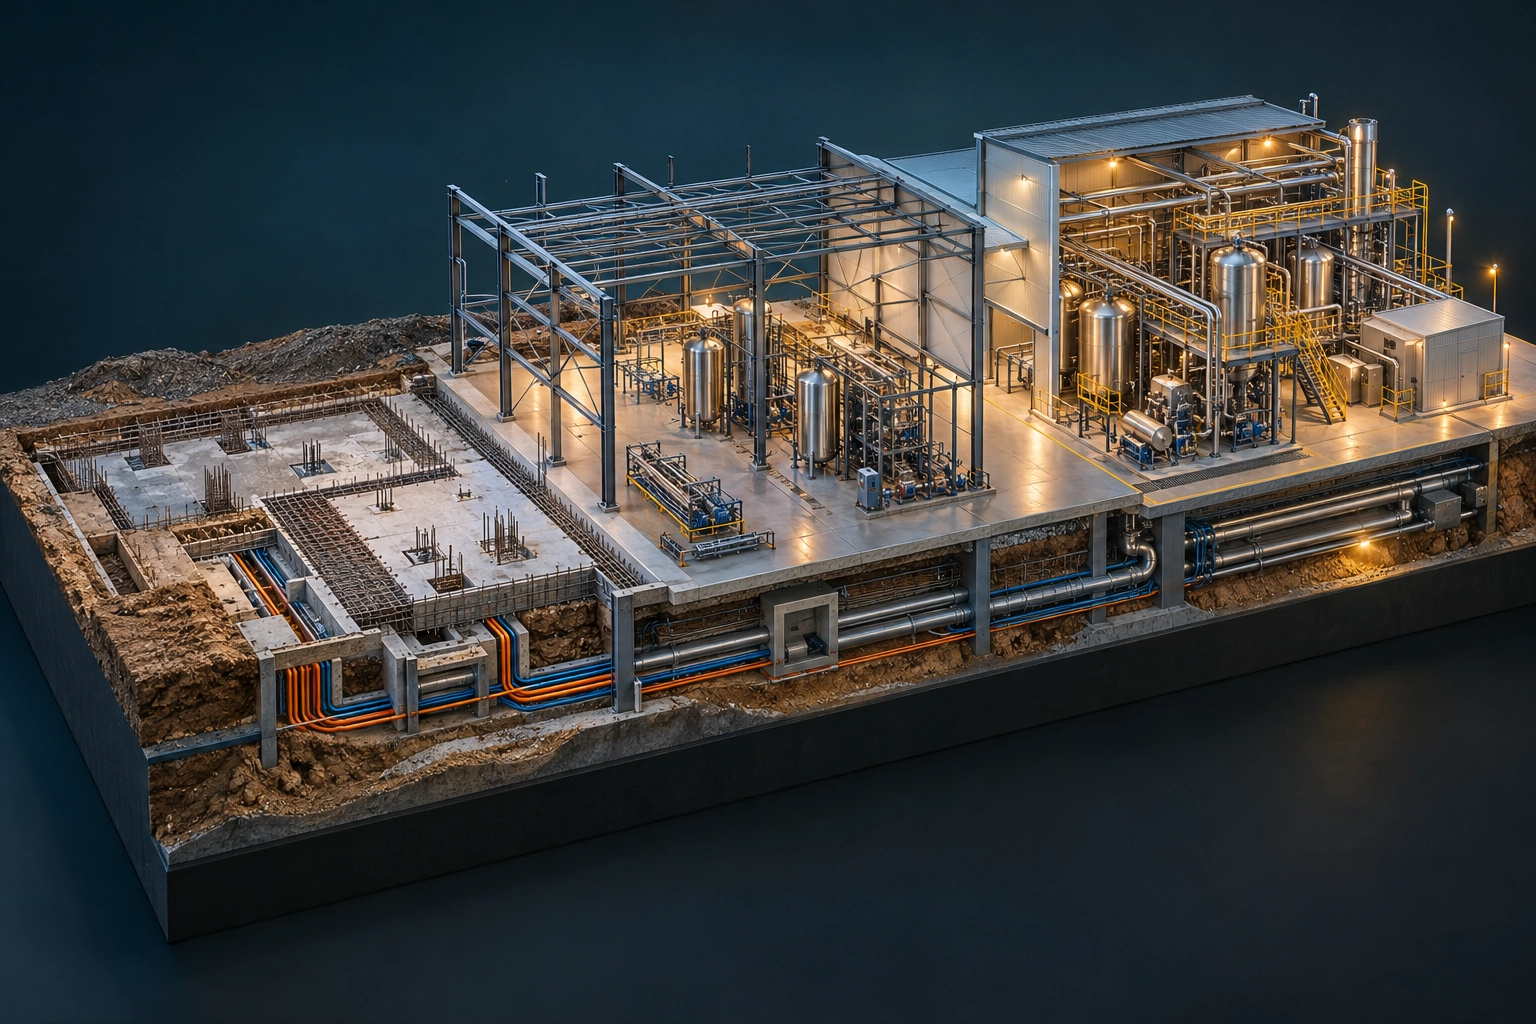
Conceptual engineering visualization: Ceramic Filtration Cost-per-Gallon and NPV Model
Conceptual engineering visualization · AI generated

Why the Work Mattered

Purpose and Operating Need

Built the capital case by comparing ceramic crossflow with continued replacement of legacy filtration components and recurring media costs.

Engineering Approach

Engineering Approach

Built Cost-per-Gallon, NPV, Breakeven, Labor, Media, Electrical, CIP, Membrane-Life, and Expansion-Deferral Models.

Outcome & Engineering Context

Built the capital case by comparing ceramic crossflow with continued replacement of legacy filtration components and recurring media costs.

Workstream Results & Impact

Workstream Portfolio Rollup

18,317,000 USD

Wine Clarification and Vinegar Polishing Modernization

Recorded workstream portfolio reference. This is the workstream-level value and is not a project expenditure or a new total of reassigned projects.

Measures & Operating Detail

MeasureValueType & meaningAttribution & operating context
Annual OPEX Premium of Legacy Alternativeapproximately 150,000 USD/yearEstimate
Option cost difference

Applies to: Ceramic Filtration Cost-per-Gallon and NPV Model

Option comparison — $472K Filtration supplier + Filtration supplier alternative plus approximately $150K annual OPEX premium.

Operating Benefit229,000 USD/yearActual Result
Operating Benefit

Applies to: ceramic membrane ceramic-crossflow system integration

Recorded ceramic-filtration OPEX reduction of approximately $229,000 per year. The related labor-cost measure and financial-option comparisons are separate analytical views of this project.

Engineering scope and design basis

Recorded $229K/year OPEX reduction; separate business-case return reference of 1.5 years; ceramic capital option; $472K filtration supplier + Filtration supplier capital alternative plus approximately $150K/year estimated OPEX premium. The return reference is a business-case value, not an observed payback period.

Capabilities Demonstrated

Actions, Methods & Controls

ACTIVITIES IN CONTEXT

Additional Technical Detail

Roles & contributions
  • Project Ownership

    Full lifecycle project ownership

    Owned the full project lifecycle: capital planning and prioritization, need definition, feasibility and scope development, engineering and AFE justification, procurement and vendor coordination, construction sequencing and field oversight, commissioning, turnover, and post-startup support. Connected operating requirements with technical scope, funding decisions, execution readiness, and the needs of operations and maintenance.

Workstream context
All portfolio connections
Project ownership and delivery context

Owned the full project lifecycle: capital planning and prioritization, need definition, feasibility and scope development, engineering and AFE justification, procurement and vendor coordination, construction sequencing and field oversight, commissioning, turnover, and post-startup support. Connected operating requirements with technical scope, funding decisions, execution readiness, and the needs of operations and maintenance.

Compared filtration options against demand and lifecycle requirements, integrated CIP and instrumentation with dedicated electrical feeds, and developed clean-water-flux tracking and maintenance follow-up. Ion-exchange testing extended the investigation into product clarity and quality, while modular expansion planning connected the equipment choice with future operating demand.
Related methods and applications
Related analysis and application artifacts
Connected collections

WHAT COMES NEXT

Complex Challenge?
Let’s Work Through It.

Engineering leadership, capital projects, and independent consulting.

Start a conversation ↗